In this article, we touch on what synthetic application availability testing is including reasons why you should consider using it in your Citrix environment. We then discuss two specific products that exist in the market to achieve synthetic availability testing against virtualised applications and desktops.
Contents
- 1. Synthetic availability testing is important, here’s why
- 2. Which products provide availability testing?
- 3. Application probing – a closer look
- 4. Application probing in action
- 5. Goliath Application Availability Monitor (GAAM) – a closer look
- 6. Application Availability Monitor in action
- 7. The pros and cons of each product
- 8. Conclusions
Synthetic availability testing is important, here’s why
Before I explain the importance of application availability testing, it is wise to cover in simple terms that synthetic availability testing is the process of automating real user actions and analysing the outcome. It has been referred to as logon simulation, though modern tools are more advanced, and is often accomplished by the use of logon simulator agents.
Say you have a Virtual Apps deployment that offers access to critical applications to users who may be anywhere in the world. With typical monitoring solutions, we can constantly check the health of our Citrix infrastructure and alert when parts of the infrastructure become unhealthy or starts to perform badly. Synthetic application availability testing takes a different approach and adds value to basic monitoring solutions.
With synthetic application availability testing, we are automating the same actions a user would take to launch their virtual applications and/or desktops. What this means is that typically a test will automate browsing to StoreFront, authenticating, clicking on an application or desktop, launching that application or desktop, and connecting to it via Workspace app and so on.
All these steps are recorded from a success/failure standpoint. Some availability testing products also record the time to complete each step, as a success does not necessarily mean that your users are getting the experience they expect. Ideally, test results are integrated with your monitoring solution dashboard, so you can view the results of each simulation in real-time, or potentially historically. Some products generate automatic alerts if a failure occurs in a step, or a step is taking too long to complete. This means customers are proactively alerted to issues in an environment before users are impacted.
Synthetic availability testing adds value to existing monitoring solutions by actually performing the same steps that a user takes to launch applications and/or desktops. This approach to monitoring gives further benefits to monitoring infrastructure components with probes and measurements. It also can free up the ICT teams who look after your Citrix environment. Typically, dedicated teams have a list of checks they need to perform in the morning or throughout the day, and many of those checks include launching applications and desktops. Now, synthetic availability testing can do that for you, which frees up a lot of staff time so that they can divert their efforts to other tasks. Even better, some synthetic solutions do this from your key user locations, testing the entire infrastructure along the way.
Which products provide availability testing?
We will concentrate on the following two products that offer synthetic availability testing today:
- Application probing, a feature within Citrix Director 7.18 and above.
- Goliath Application Availability Monitor (GAAM) from Goliath Technologies.
Application probing – a closer look
Application probing is a feature that shipped originally with Citrix Director 7.18. The configuration simply consists of one or multiple agents (also referred to as probe agents) that automate the launching of published applications. Results are then fed into Director.
The agent is installed on a Windows machine that must have Receiver for Windows 4.8 or newer, or Workspace app 1808 for Windows or newer installed. You configure the agent to connect to Director and configure probes directly from the Director console. The initial setup requires few actions and is easy to complete.
Given that there are many steps involved with launching an application, application probing analyses the below steps and reports on their failure or success:
- StoreFront reachability
- StoreFront authentication
- Application enumeration
- ICA file download
- Application launch
The benefits of application probing is that it is effectively testing the majority of your Citrix infrastructure for you. For an application launch to be successful the Delivery Controllers, StoreFront servers, and the VDAs etc. all need to be working as expected.
Application probing in action
When you deploy a probe agent, and after configuring it to probe an application, the Director dashboard will display Application Analytics results over a period of 24 hours. The Applications page is basically a quick summary that you can check on to review probe results. It shows the number of probes that are configured within your Site, the application(s) being probed, probe results from the last 24 hours, and the number of application faults etc. as a result of failed probes.
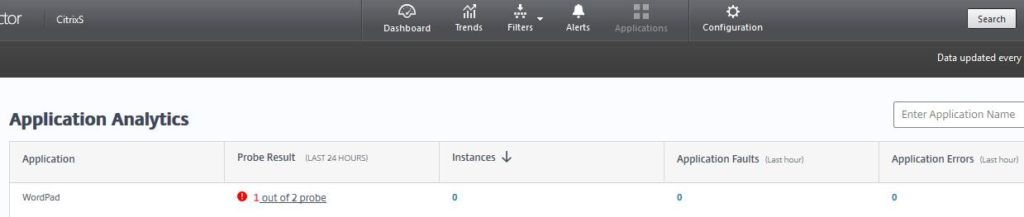
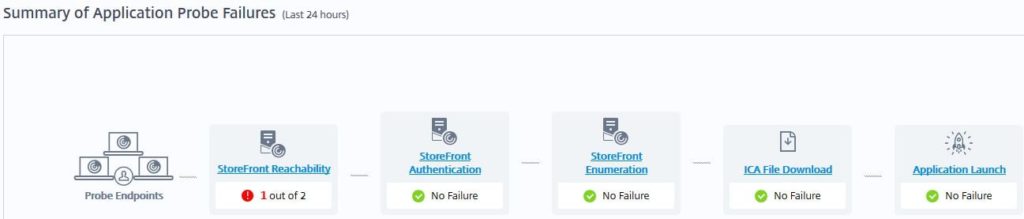
Towards the bottom of the Application Analytics page appears the Summary of Application Probe Failures panel that lists out each component that application probing tests, and if there have been any failures with any of these components over the past 24 hours. As you can see from the below screenshot, 1 probe out of 2 failed at the StoreFront Reachability stage.
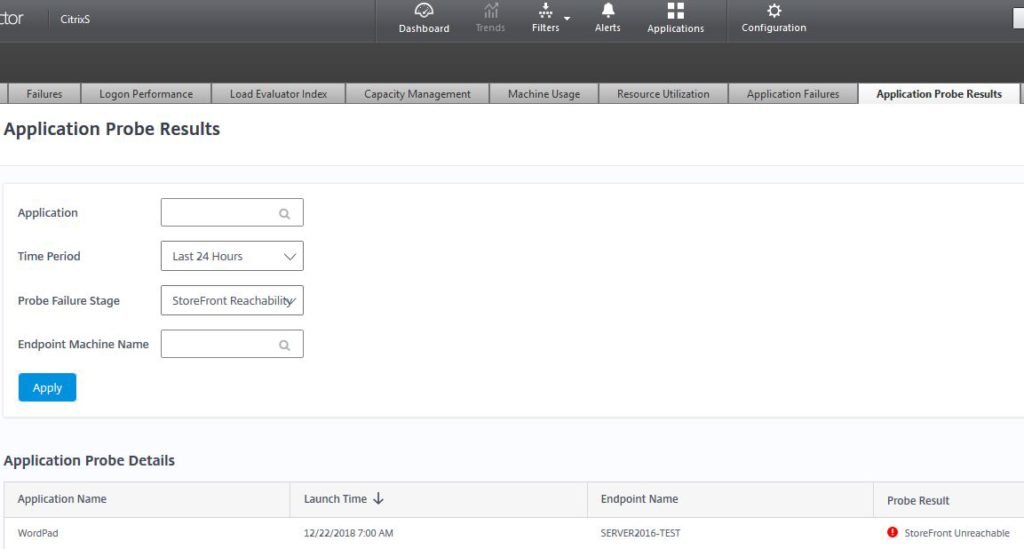
If you click on the StoreFront Reachability hyperlink, you can see a filtered results view, which in this case is showing the probe results that have failed at the StoreFront Reachability stage, over the last 24 hours. This is simply a filtered view under Trends -> Application Probe Results.
You can change the filter conditions to show all probe results over the past 7 days for example. Some probes in the below example failed at the StoreFront Reachability and Application Launch stages.
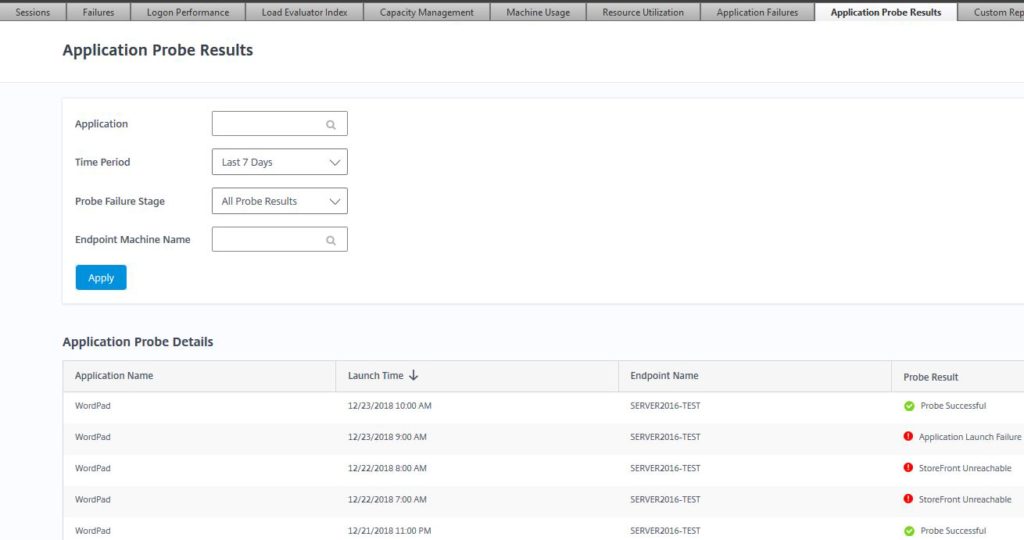
You also have the option of viewing results over 24 hours. If you want to view results for a specific application, simply type the application name in the Application field.
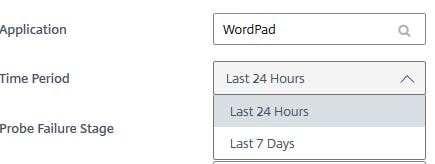
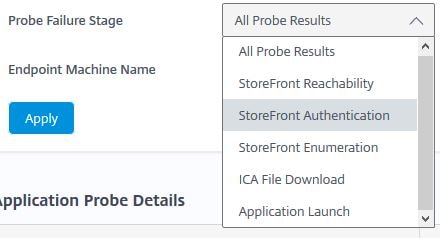
The different stages can also be used to filter the results.
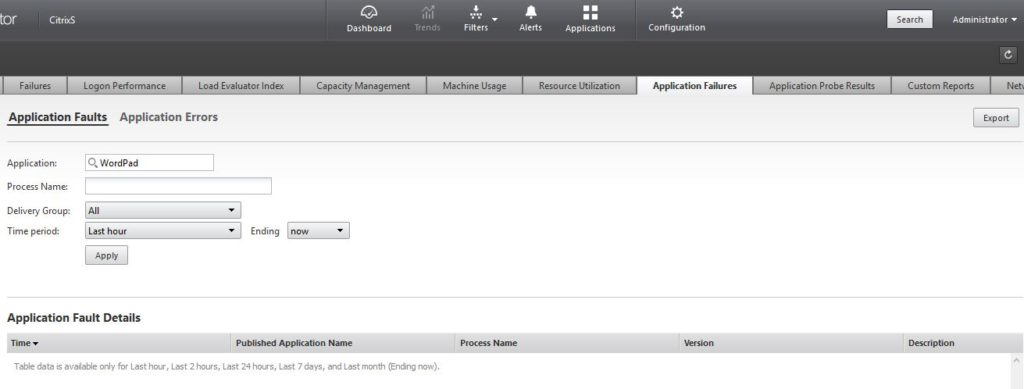
If any probe fails at the Application Launch stage, failures are also recorded under Trends -> Application Failures. You can export this data to PDF, CSV or Excel format.
Goliath Application Availability Monitor (GAAM) – a closer look
Application Availability Monitor is a synthetic application availability testing tool from Goliath Technologies. You can deploy GAAM as a standalone product, or as a fully integrated part of the Goliath Performance Monitor solution, which is what I have done during my evaluation of the product. Results from simulations are fed into the Goliath Performance Monitor web console for additional troubleshooting.
GAAM can simulate the launch of either published applications or desktops across Virtual Apps and Desktops environments. This is done by using one or more Intelligent Agents, which are Windows machines (physical or virtual) that have the GAAM agent installed. These machines can be in your local datacentres, or even in AWS or Azure public cloud.
Simulations are performed at set times of the day of your choosing, and GAAM offers very flexible simulation schedules based on your requirements. For example, you may want to run simulations before your critical user base logs on for the day, or you may want to run simulations as frequent as every 30 minutes every day to support a 24/7 environment.
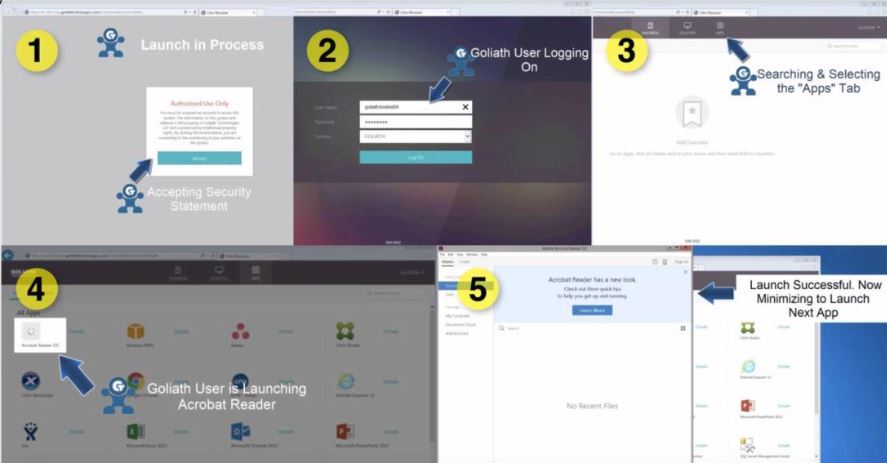
GAAM simulates logging on to StoreFront, or Citrix Gateway using the Internet Explorer 11 browser. Applications and/or desktops are launched via an HDX connection, and then the HDX session is logged off. The time taken to complete the various steps involved in the launch process is captured, as well as the success and failure of these steps. Uniquely, screenshots are also taken of each step to prove that the step either worked, or to show the failure point and any error that may have come with it. This is crucial to capture both elusive client-side errors, and document issues with other team members or outside vendors for faster resolution.
The benefits of Application Availability Monitor are that it is effectively testing the majority of your Citrix infrastructure for you. For an application launch to be successful the Delivery Controllers, StoreFront servers, and the VDAs etc. all need to be working as expected as well as the network connections at each location. GAAM ensures the entire delivery infrastructure is working in concert as intended.
Application Availability Monitor analyses the following steps and reports on their failure or success, and time to complete:
- Access to StoreFront (via Internet Explorer).
- Authentication to StoreFront.
- Application/desktop enumeration.
- Application/desktop launch.
Application Availability Monitor in action
To configure GAAM, you deploy one or more Intelligent Agents within your environment. The agents will typically be deployed in locations that match where your users are located. Once an agent is configured and ready to be used, you create flexible probe schedules for applications and/or desktops of your choice. Whilst agents may be distributed across many locations, GAAM’s centralised command and control makes scheduling and management easy. Goliath customers have reported running 15,000 tests per day with GAAM, which would otherwise be extremely difficult and time consuming to schedule or manage with Application probing.
As probes run per the schedule defined, the Application Availability tab of the Goliath Performance Monitor web console is where you can go to get a view of the results.
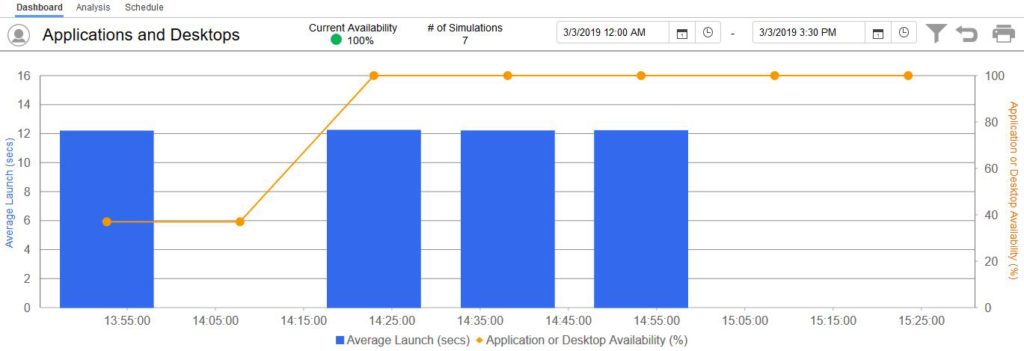
The main Dashboard view can be filtered based on date/time, allowing you not only to view current probe results, but historic ones as well. It shows the current availability of the resources you are probing. It also reports the number of simulations that have executed during that time period, and a bar chart displays depicting the application or desktop availability percentage, and the average launch time (in seconds).
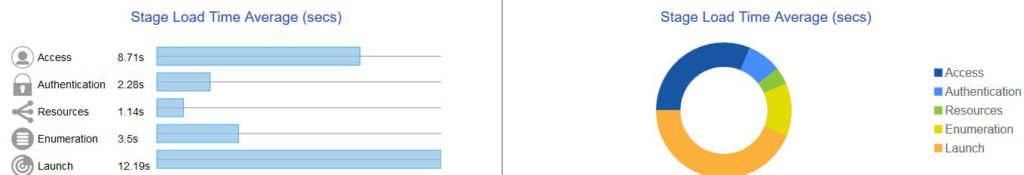
Towards the bottom of the Dashboard sub-tab shows the average time to complete each simulated step in the logon process, and a chart for easy viewing of each step and where most of the load time is encountered.
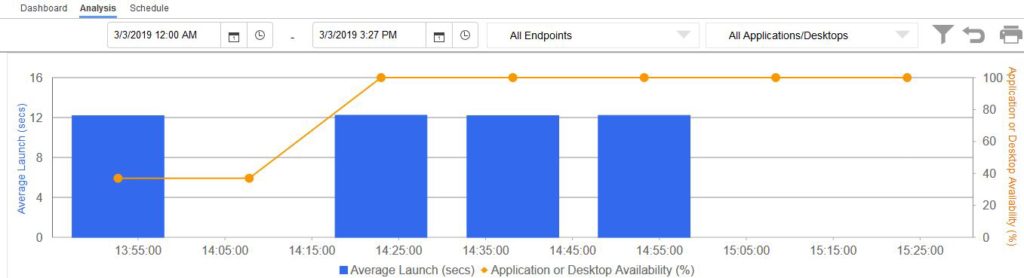
The Analysis sub-tab shows results per simulation. Results can be filtered on date/time, including by the Intelligent Agent running the probe, and including by the application/desktop that is being probed. The same bar chart that can be found on the Dashboard sub-tab is also displayed here. It’s important to note that GAAM allows you to store this information for as long as you wish, allowing the same granular views to be seen going back weeks or even months for detailed analysis or troubleshooting.
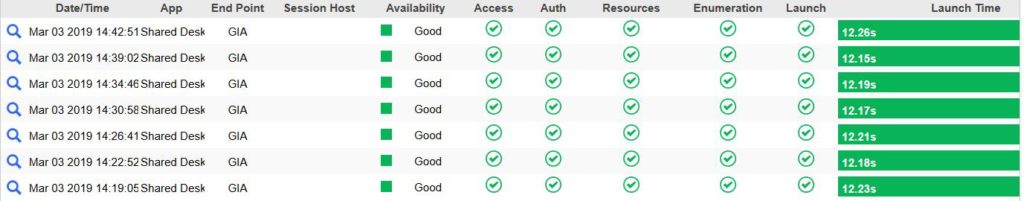
Towards the bottom of the Analysis page is the results of each probe depending on the date/time filter you have applied. In the example below, we can see that the simulations are all appearing as healthy. The Access, Auth, Resources, Enumeration, and Launch steps have green ticks, and the launch time is recorded healthy. The end point running the simulation is recorded, as well as date/time and the application/desktop being probed. If you want to view more details about a specific test, simply click on the magnifying glass.
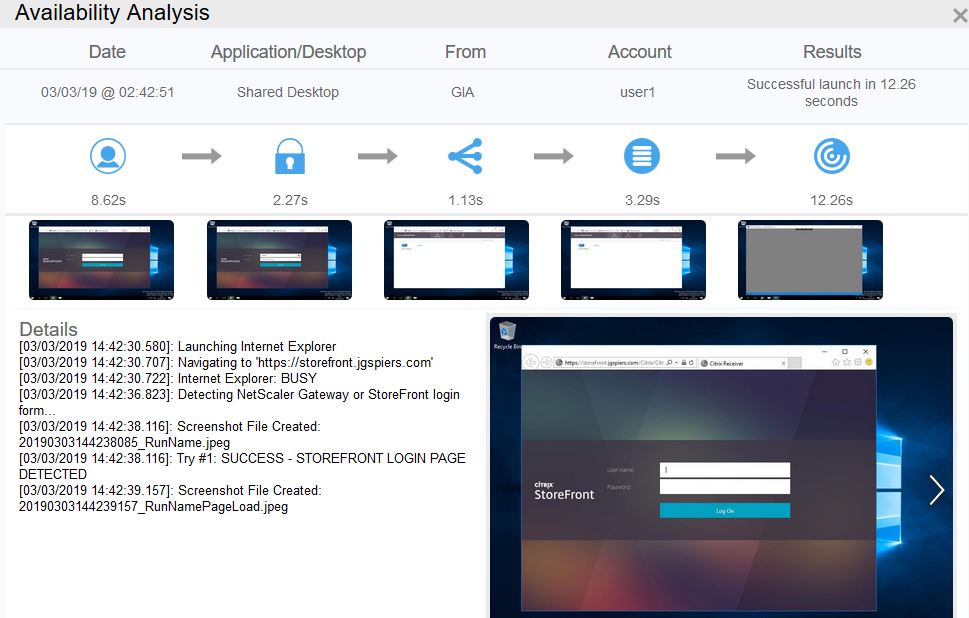
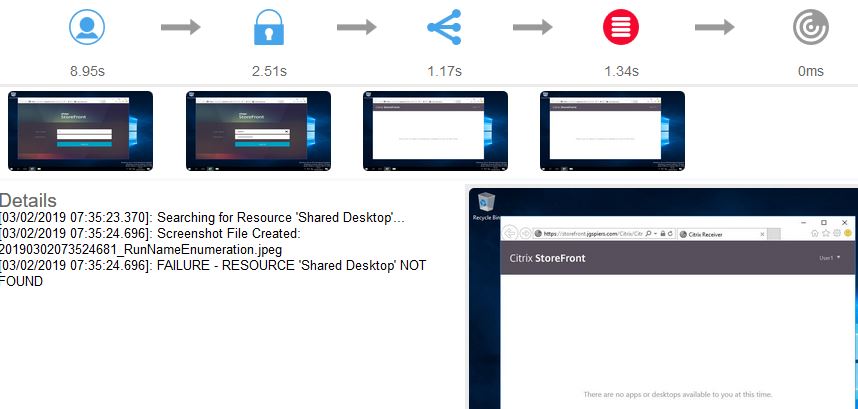
Once you click on the magnifying glass to open a specific result, a new window appears with in-depth information regarding the simulation. Each icon coloured in blue is clickable and represents each simulated step. A log of the actions taken to complete each step appears on the left, and a screenshot for proof is displayed on the right. Clicking on the screenshot will enlarge it to full-screen. In this example simulation, the Details section reports that Internet Explorer was launched, StoreFront was navigated to and the login page was detected. At this stage the step was marked as complete and a screenshot was captured by and stored on the Intelligent Agent machine.
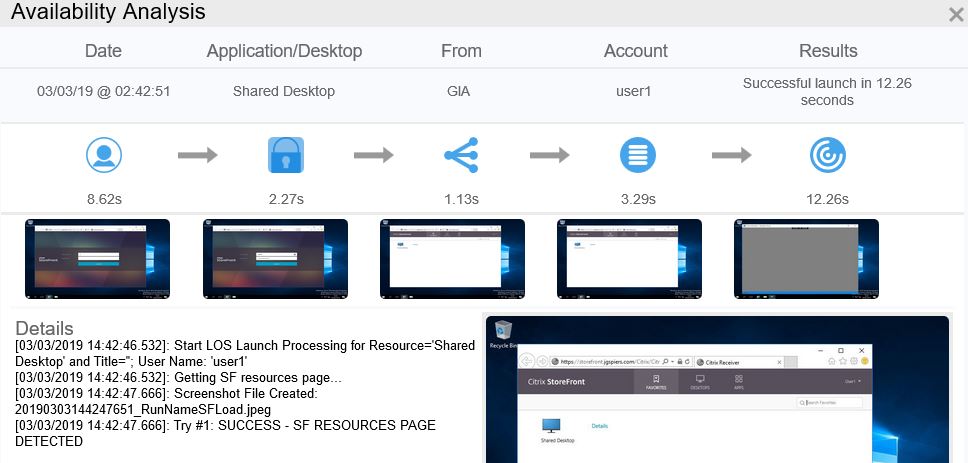
Clicking on the resources step icon reports information related to that step, and a screenshot to show that the step was successful. In this case, the resources page was detected.
If you have any simulations that have encountered a failure, they will also display under the Analysis page. The web page makes it easy to spot failures by using red colour coding against the step that failed. In this example, you can see that one of my simulations has failed at the Resources step.

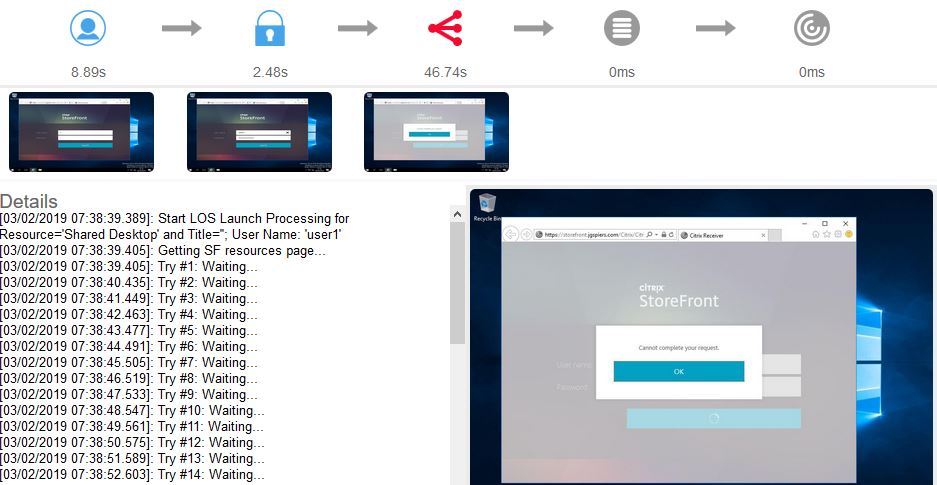
Clicking on the magnifying glass and then on the Resources icon shows numerous Waiting messages, but straight away we can simply glance at the screenshot captured by GAAM and discover the Cannot complete your request error message. In this example, some services were in a stopped state on the StoreFront server.
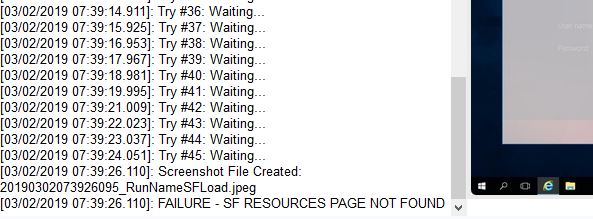
Scrolling to the bottom of the details pane shows error message FAILURE – SF RESOURCES PAGE NOT FOUND.
Another failure example shows an error at the Enumeration step. The Details pane shows error FAILURE – RESOURCE ‘Shared Desktop’ NOT FOUND, but the screenshot is more interesting: There are no apps or desktops available to you at this time. In this example, Delivery Controllers could not be contacted for resource enumeration.
On the Schedule sub-tab of Application Availability, here you can create and manage all of your probes.
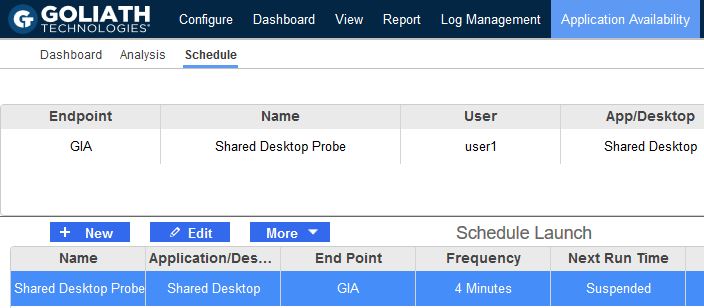
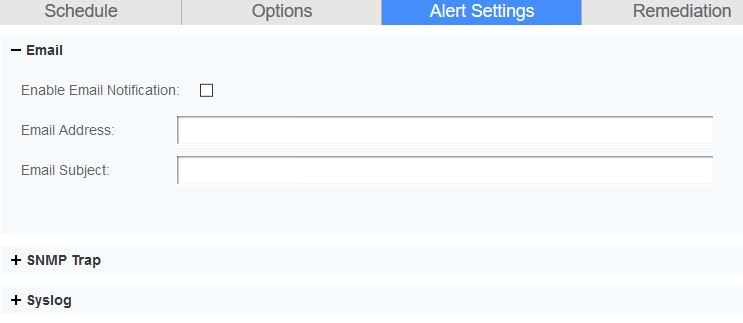
For each probe, you can launch one or multiple applications and/or desktops. Alerts can also be configured during the creation of a probe under the Alert Settings tab. Currently Email, SNMP, and Syslog are available alerting options.
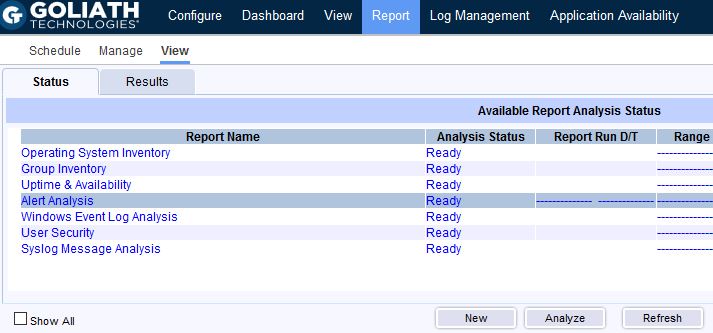
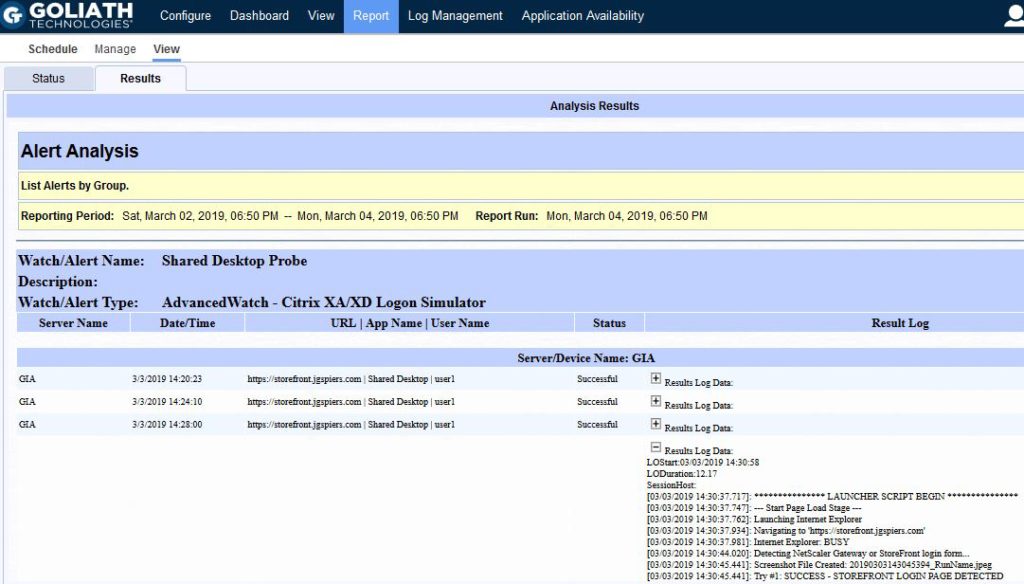
Reporting on the results of one or more simulations is also possible by clicking on the Report tab within the console. You can schedule a report from under the Schedule sub-tab to run at selected time periods, and have each generated report emailed to you or exported as a PDF, CSV or HTML file. Alternatively, you can report on-demand from the View sub-tab by clicking on the Alert Analysis report name and clicking Analyze.
Once an on-demand report is ready for viewing, the Results sub-tab will become clickable and allow you to view the full report. Each simulation is shown based on the time period you selected, and a history of the log/details data is available. On-demand reports can also be printed, emailed, or exported.
The pros and cons of each product
Citrix Application probing
Pros:
- Probe results are shown direct from the Director web console, which eliminates the need for a separate console.
- Citrix Gateway is supported with the 7 1811 release of Director.
- Citrix Cloud/Workspace is supported.
Cons:
- A small, lightweight agent needs to be placed on a dedicated machine from which probes will run from.
- The time it takes to complete each stage of the probe is not captured. For example, application enumeration time to complete is not calculated.
- Requires a Premium (formerly Platinum) Virtual Apps or Virtual Apps & Desktops license.
- Reporting capabilities are scarce.
- You cannot probe desktops, only published applications. To probe desktops, Citrix released Desktop probing in Virtual Apps and Desktops 7 1906.
- There is no current ability to schedule probe repeats. You need to create a new probe to select different probe execution times. For example, if you want to set up a simulation to test every one hour through the day, you have to configure 24 probes separately.
Goliath Application Availability Monitor
Pros:
- The Intelligent Agent can bypass disclaimers set on your VDAs.
- Both simulations via StoreFront and Gateway is supported.
- Reporting capabilities are available for one or multiple simulations, and reports can be run on demand or via a schedule. Additional reports can be created with 3rd party tools like Microsoft Power BI or Tableau.
- Success, failures and also the time taken to complete each step in the simulation is captured.
- Screenshots are captured for each simulated step. This acts as visual proof where a step has succeeded or failed, captures any on-screen error messages, and can provide objective documentation of issues for working with team members or vendors.
- SSO and MFA are both supported.
- Results are integrated into Goliath Performance Monitor for further troubleshooting. For example, slow synthetic application launch times can be reviewed from Goliath’s logon duration details.
- Citrix Virtual Apps and Desktops are supported along with VMware Horizon and Microsoft RDS.
- A single agent can easily manage tests of multiple applications, desktops, or user credentials – all managed and scheduled centrally.
Cons:
- A small, lightweight agent needs placed on a dedicated machine.
- The machine that runs simulations must always be logged on as a local administrator account. Goliath Technologies do however provide an AutoLogon tool.
Conclusions
To wrap up the article, I’ve left some thoughts about where I think each product fits into an environment, based on the customers’ requirements:
Citrix Application probing
Application probing from Citrix is an easy to deploy, and relatively easy to configure product. When I say easy, you could easily configure it in under 30 minutes and have probes running against your most critical applications.
If you already have Premium (formerly Platinum) licensing for your Citrix Virtual Apps or Citrix Virtual Apps and Desktops deployment, then application probing comes as a nice value add at no extra cost.
The environments I see application probing fitting into today would be:
- Organisations that:
- are small in size and that do not deploy too many applications.
- have simple probe scheduling needs, and do not need to probe desktops.
- are only interested in probing their most crucial applications.
- can live without any advanced reporting.
- want to keep the number of consoles at a minimum, providing Application probing provides benefits to them.
- are only interested in success and failures of the simulated steps, rather than the time to complete such steps.
When it comes to large enterprise environments that have many different applications, with users connecting in from different parts of the world, Application probing may not tick all the boxes. Some organisations require advanced reporting functionality. Organisations also may simply not have Platinum licensing or the ability to procure such licensing.
Goliath Application Availability Monitor
Like Application probing, the Application Availability Monitor product is also easy to deploy, configure, maintain, and manage going forward. GAAM also offers an array of advanced capabilities for your testing needs.
If you already use Goliath Performance Monitor in your environment, or you need more detailed monitoring and troubleshooting of your Citrix environment, using both GPM and GAAM together is an obvious solution to those who need a proactive early warning system of issues in their environment.
The environments I see Application Availability Monitor fitting into today would be:
- Organisations that:
- are large in size and have a requirement to run simulations against many different applications.
- have a requirement to run simulations against published desktops, or against multiple VDI platforms.
- need advanced reporting and alerting capabilities for their simulations.
- require the added value of screenshots of each simulated step and the time taken to complete each step.
- use SSO or MFA.
- use disclaimers and need to bypass them during simulations.
- need more flexible scheduling capabilities and can make use of the advanced features that GAAM offers.
For customers who want synthetic application availability testing within their environment, they should evaluate not just the cost of Application probing or 3rd-party products such as Application Availability Monitor, but also the capabilities of each product to discover which one ticks most of the boxes.
Organizations looking to proactively solve end user experience issues in their environment should look no further than GAAM, the early warning system from Goliath Technologies. In terms of depth of information provided for each simulation, and the array of advanced capabilities that are on offer. The advantages of the product surpass having to manage an extra monitoring system outside of Director.