When we virtualise desktops and applications in a Citrix environment, one of the most important success factors is providing end-users with quick logons to those resources. This is often a difficult challenge that usually result in hours of tweaking, fine-tuning, and lengthy testing. In this article, we take a look at Goliath Technologies’ monitoring software, and how this product accurately provides uniquely detailed in-depth logon measurements to allow you to effectively monitor and troubleshoot logon times in a quicker, more effortless way.
Contents:
- The logon process
- What has the potential to impact logons?
- How will you know?
- The normal logon:
- The slow logon:
- The extra slow logon:
- Summary
The logon process
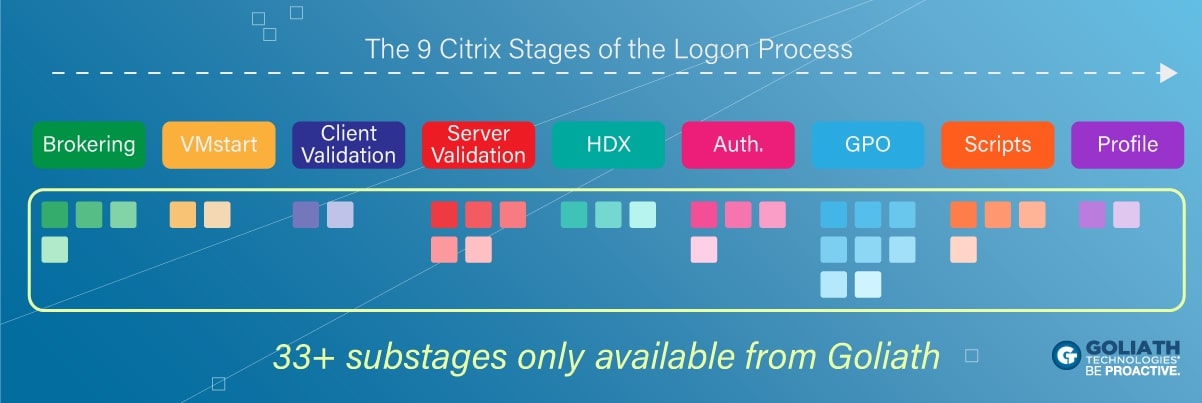
If we take a quick but important look at the logon process, it becomes evident that over 30 steps are required to complete a successful logon. With so many steps and communication between various infrastructure components, it can be a challenge to optimally have each step performing in a way that will keep end-users happy, and productive, by offering fast access to desktops and applications. Some of the main steps in the logon process include:
- Citrix Workspace app launch, connection and authentication to StoreFront.
- Alternatively, access to StoreFront via a web browser.
- Application and desktop enumeration via StoreFront and Delivery Controller communication.
- Delivery Controller brokering and provision of an ICA file to the client.
- Launching and establishing an HDX connection to an available VDA, as per the contents of the ICA file.
- User session creation and Citrix policy processing.
- User authentication between Active Directory and the VDA.
- User profile load, Group Policy and logon script processing.
- Shell initialisation and load.
What has the potential to impact logons?
Some of the reasons a logon can slow include, but are not limited to:
- Large profile size, when for example using Roaming Profiles or Citrix Profile Management.
- Logon scripts.
- The amount of configured Group Policy settings.
- Lack of hypervisor resource/resource constraint.
- Lack of VDA resource, lack of available VDAs, resource constraint.
- Incorrect Active Directory configuration.
- Overloaded Domain Controllers, StoreFront servers, or Delivery Controllers.
- Slow network connections between client endpoint and StoreFront, or client endpoint and VDA.
How will you know?
One of the many challenges a Citrix administrator faces is knowing what is causing a slowdown in logons, or why a logon was slow, even if it was just a handful of logons. This is where monitoring solutions add value to your existing environment and take much of the guesswork out of the troubleshooting and identification process.
It is known that various products exist that can record logon time duration. Take Citrix Director for example. The problem you may face with many of these products is simply the lack of detail that is captured and presented to you when it comes to logons, which results in potentially extra hours getting to the root cause. For example, you might look at a slow logon report and find that GPO processing was slow, which is great, but what exact GPO is causing the slowness in this instance? It could take a serious amount of time evaluating GPOs, testing them in a non-production environment and applying them one by one until you find the culprit.
As another example, if the monitoring product doesn’t investigate application enumeration times, how long will it take before you investigate this as being the cause of your user’s logon slowness? I can tell you that this is something you will likely overlook nine times out of ten, but it is a point in the logon process that absolutely can have an impact.
Therefore, getting to the root cause before more business productivity is lost is the end-goal here. Not only is this great for the end-users, but it is also advantageous to the Citrix administrator, who can get on with other parts of his/her job.
Goliath Technologies set themselves apart with a product that provides extensive amounts of information around logon durations, providing just the information that is needed to get to the problem point faster than ever. Goliath Performance Monitor does this by providing metrics for over 33 steps in the logon process. Three examples of logon times, with two being slow-logon scenarios caused by different issues are shown below:
The normal logon:
- Time to logon: 38 seconds.
A 38 second logon is acceptable by all means. This is a fresh Windows 10 VDA install I am connected to, so it would definitely be possible to reduce the logon times after some optimisations.
Via the XenApp & XenDesktop page, Goliath Performance Monitor reports a logon duration of 38.1 seconds.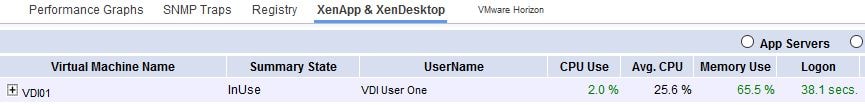
If we click on the plus arrow beside my virtual machine name, more detail on the logon steps and their processing times is shown: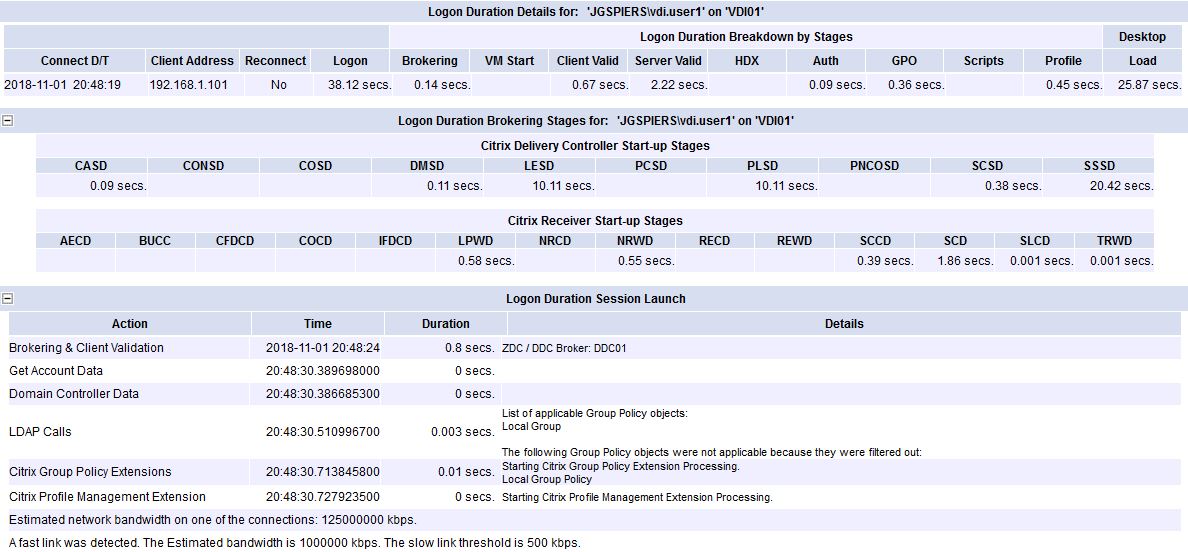
Logon duration metrics of interest:
- PLSD: In this logon example, I used Citrix Profile Management, and the profile load time reports in at 10.11 seconds.
- GPO: Nothing wrong with GPO processing times, coming in at 0.36 seconds.
- Brokering: This element in the logon process is also great, at 0.14 seconds taken for the Delivery Controller to broker my connection on to an available VDA.
The slow logon:
- Time to logon: 74 seconds.
- Reason: Desktop load.
74.5 seconds is cause for concern, and Goliath Performance Monitor rightly highlights the time in red for our attention.
Via the XenApp & XenDesktop page, Goliath Performance Monitor reports a logon duration of 74.5 seconds.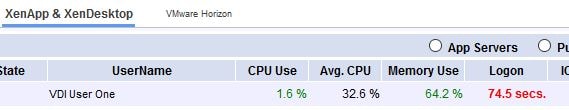
Drilling into the logon time: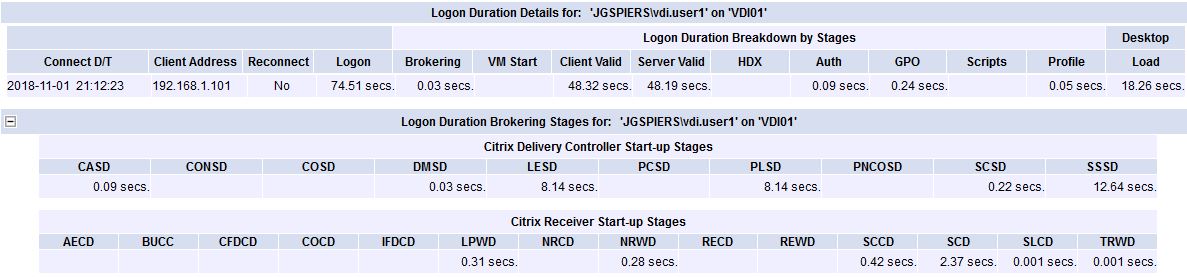
Logon duration metrics of interest:
- Client Valid: The time spent validating the client side session. Normally this metric references any delays that happen on the client-side. For example, launching Citrix Receiver, DNS resolution, establishing connections etc.
- Server Valid: The time spent validating the server side session. Normally this metric references any delays that happen on the server-side. For example, making sure the VDA is ready to host a session.
The extra slow logon:
- Time to logon: 158 seconds.
- Reason: Large profile.
158 seconds, let’s hope that never happens in our production environment!
Via the XenApp & XenDesktop page, Goliath Performance Monitor reports a logon duration of 158.1 seconds.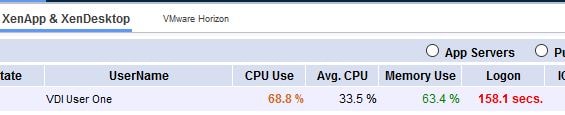
Drilling into the logon time: 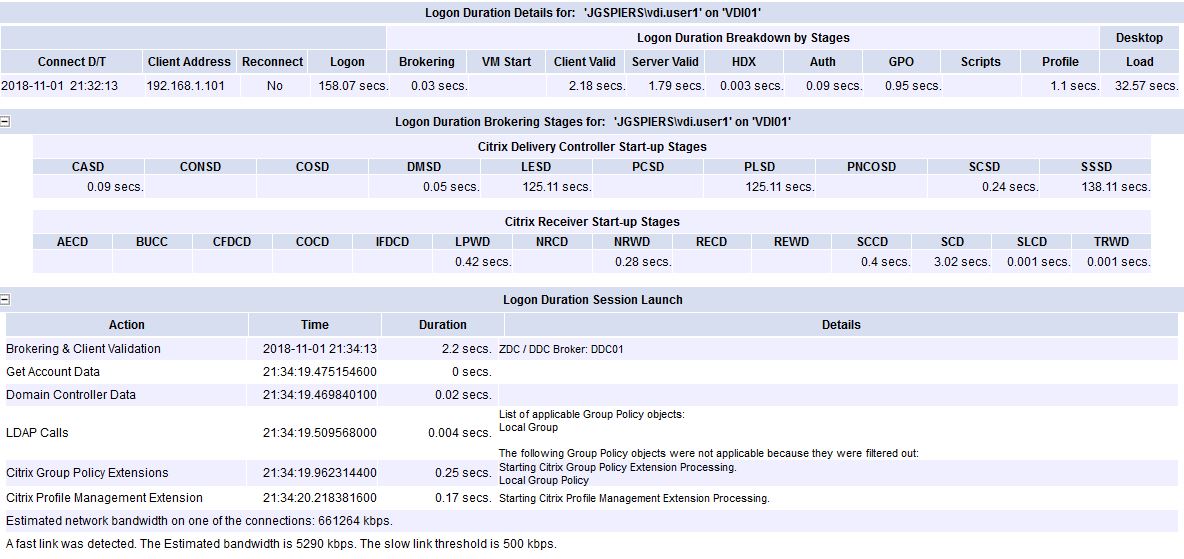 Logon duration metrics of interest:
- PLSD: This metric is profile load time. At 125 seconds, it is clear that either the profile configuration was wrong, or the profile itself was overly large. In my example, the latter applied.
Summary
With so much data passed to you, you can rule out many steps in the logon process quickly, allowing you to draw a conclusion and reach the root cause of logon slowness much faster, keeping your user’s happy.
As shown in the above screenshots, you can see the many different steps that are recorded when a user logs on to their desktop or application. Not only does Goliath Performance Monitor record the GPO processing time, profile load time, script processing time and so on, but it goes well beyond this, capturing application enumeration time, brokering time, HDX session establishment time, how long it takes to obtain applicable Group Policies, how long authentication takes and much more.
If you are intrigued by all the different metrics that Goliath Performance Monitor reports on but I have not mentioned, I recommend the comprehensive Complete Guide to Understanding The Citrix Logon Process guide. A small example of the metrics and their meanings are listed below:
- DMSD – The time is takes to map client drives, devices and ports from the client device.
- SSSD – The complete high-level time it takes to perform the entire start-up operation.
- NRWD – The time it takes the Delivery Controller’s XML service to resolve the name of a published application or desktop to a VDA address.
- SCCD – This metric starts as close as possible to the time of the request (mouse-click) and ends when the ICA connection between client and VDA has been established.
- SCD – The time it takes from wfica32.exe launching on your client machine to a connection being established with a VDA.
With Goliath Performance Monitor, you can quickly see the value that such in-depth logon reporting provides. Also note that historical data reporting is possible with the product and you don’t lose any data by way off database trimming, or purging of old data. Without a doubt, there is no comparison between the level of detail found in Goliath Performance Monitor and other tools like Director, etc.
If you’d like to see how Goliath Performance Monitor can proactively solve logon duration and other ‘Citrix is slow’ issues in your environment, you can download a fully functional, fully-supported 30 day free trial here.
Pingback: Advanced Logon Duration Troubleshooting with Goliath Performance Monitor
Pingback: How to Troubleshoot the 33+ Stages of the Citrix Logon Process
Pingback: How To Solve Slow Citrix XenApp/Desktop Logons with the Logon Report
Brandon Clark
March 10, 2019Are there any metrics which detail folder redirection times?
Pingback: Why Is Troubleshooting “Citrix is Slow” So Hard?
Pingback: User Story: Free Trial Delivers Real Citrix Troubleshooting
Pingback: How to Troubleshoot Citrix Logon Issues
Pingback: User Story: Epic Hospital Reduces Logon Times by 80%
Pingback: Advanced Logon Duration Troubleshooting with Goliath Performance Monitor
Pingback: Goliath Technologies Delivers Unmatched Troubleshooting Capabilities in New Release