Citrix Director is the excellent monitoring tool and analytics collector for XenApp and XenDesktop 7+ that is key for both helpdesk users and Citrix administrators alike as it makes for easier support and management of desktop and application services. Citrix Director records user session information, user session failures, machine resource consumption, application statistics, user logon times, trends and much more.
When you install Citrix XenApp or XenDesktop a Monitoring database is created. This Monitoring database is where all Director related information is kept.
♣ What’s new Director 7.9
♣ What’s new Director 7.11
♣ What’s new Director 7.12
♣ What’s new Director 7.13
♣ What’s new Director 7.14
♣ What’s new Director 7.15
♣ What’s new Director 7.16
♣ Director 7.12 System Requirements
♣ Install Director
♣ Secure Director communications with HTTPS
♣ Director Real-time Monitoring
♣ Failure Reasons in 7.12
♣ Average Logon Duration
♣ Application and Process Management
♣ VDA Resource Utilization
♣ Top 10 Processes
♣ Trends and Historical Data
♣ Capacity Management
♣ Custom Reports
♣ NetScaler HDX Insight
♣ Director Filters
♣ Citrix Alerts Policy
♣ Director Permissions
♣ Cross Forest Monitoring
♣ Multi-Site Monitoring
♣ SCOM Monitoring and Alerting
♣ Director Data Retention and Granularity
♣ Disable Activity Manager Applications view
♣ Session Idle times Director 7.13
♣ Application Failures (7.15) and Application Analytics (7.16)
♣ Additional Notes
What’s new in Citrix Director 7.9:
- Easier interpretation of logon performance data. Number of logons now represented as a bar chart instead of a line chart as found in previous versions of the tool.
What’s new in Citrix Director 7.11:
- Integration with NetScaler MAS.
- Memory, CPU and concurrent session resource utilization reporting for desktop and server OS.
- Top 10 processes reporting.
- New alert policies to monitor and alert for ICA RTT, Logon Duration, CPU, Memory etc.
- Data export report limits for CSV, PDF, Excel. Better performace when exporting alerts and trend data.
- Director integration with Octoblu for workflow automation.
What’s new in Citrix Director 7.12:
- User-friendly Connection and Machine failure descriptions – Detailed descriptions of possible failure causes and recommended actions/suggestions – This is a Platinum feature.
- Increased historical data for Enterprise customers – XenApp and XenDesktop Enterprise customers used to receive 7 days worth of historical Director data. This has been increased to 31 days for Enterprise license holders.
- Custom Reporting – Allows you to create new reports and save them previously only possibly using OData queries manually. This is a Platinum license feature.
- SNMP trap integration with Director alerts – Create alerts and trigger actions based on SNMP trap messages.
What’s new in Citrix Director 7.13:
- Session Idle times
- Support for Adaptive Transport (view if session is running HDX over UDP or TCP)
What’s new in Citrix Director 7.14:
- Ability to monitor GPU utilisation (NVIDIA M60 and M10 with 64-bit machines currently supported), Average IOPs and Disk Latency. This adds on to the existing capability to monitor CPU and Memory utilisation since Director 7.11.
What’s new in Citrix Director 7.15:
- Application related session failures. If a published application was to fail during launch, you’ll get information recorded within Citrix Director containing the process that failed, version, and any other failure details including which machine the failure occured on. This can be helpful in identifying applications that are troublesome, unstable and need attention from the vendor.
What’s new in Citrix Director 7.16:
- You can now shadow sessions that run on Linux VDA machines that run RHEL7.3 or Ubuntu 16.04. noVNC is used to connect to these sessions.
- Application Analytics is a new feature in Director that allows you to monitor the performance of applications via a new Applications tab. This tab displays a list of all your published applications and tells you the amount of instances that are running, and the recorded errors and failures in the past hour.
- You can create customised reporting and monitoring dashboards using a new OData V.4 endpoint.
- Director now displays a warning when you are running a Delivery Controller that is older than the Director version. This is to alert you that no new features can be used until you upgrade the Site to the same version as Director.
- Director now shows the session details of users from another domain who have been assigned access to resources in Director’s home domain using Domain Local groups.
Director 7.16 System Requirements:
- Windows Server 2012, 2012 R2, 2016 Standard and Datacenter.
- Windows Server 2008 R2 SP1 Standard, Enterprise and Datacenter.
- .NET Framework 4.5.2, 4.6 or 4.7.
- .NET Framework 3.5 SP1 with Director on Windows Server 2008 R2 only.
- IIS 7+ including ASP.NET 2.0 and Static Content sub-feature (installed as part of Director installation).
- A dedicated server(s) hosting Director with 4vCPU minimum and 4GB RAM for every 100 Director users.
Supported browsers for viewing Director:
- IE 11.
- IE10 only if viewing from a Windows Server 2012 R2 machine.
- Microsoft Edge.
- Chrome.
- Firefox ESR (Extended Support Release). https://www.mozilla.org/en-US/firefox/organizations/
Note: Compatibility mode is not supported on Internet Explorer when using Director. JavaScript should be enabled in your browser for Director to work.
Note: The recommended screen resolution for viewing Director is 1366 x 1024.
Install Director 7.12:
For an unattended installation of Director, see Director unattended installation with PowerShell by Dennis Span.
It is recommended that you install Director on at least two dedicated machines for high availability. Some Citrix customers install Director alongside Delivery Controllers and this is fine however I prefer to separate all components.
Launch the downloaded XenApp & XenDesktop 7.12 media and click on Citrix Director. Accept the License Agreement and click Next.
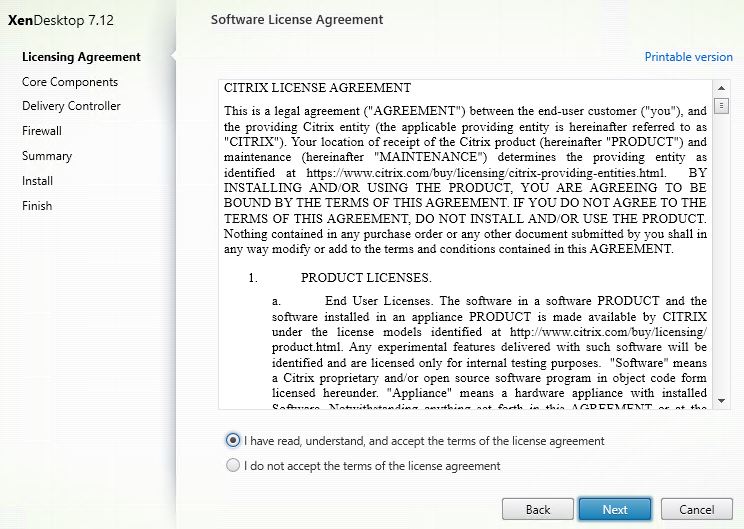
Specify an install location or accept the default. Click Next.
Note that installing Director on a drive such as D:\ for example is not supported by Citrix.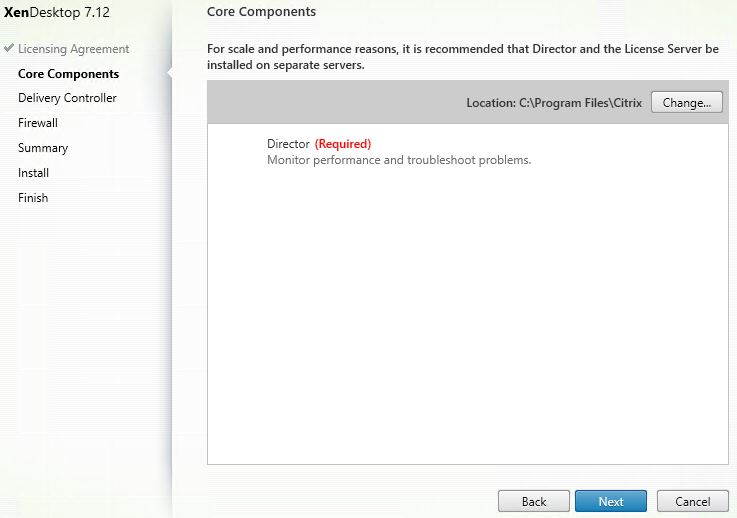
Enter your Delivery Controller FQDN address. Director will discover all available controllers within the Site and will fail over if a Delivery Controller becomes unavailable.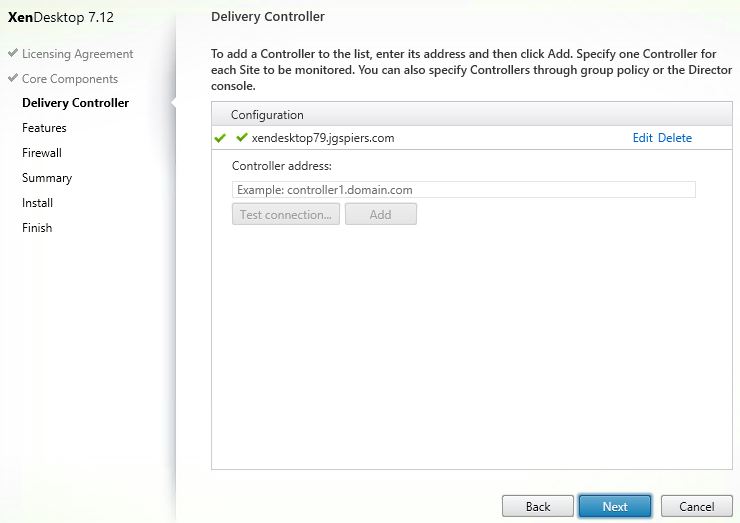
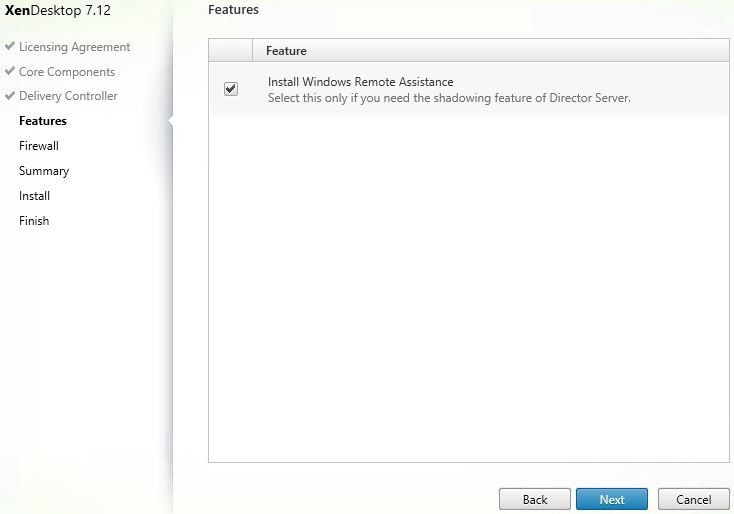
Select if you want to install Windows Remote Assistance or not. This is used for shadowing active Citrix sessions for support purposes and should be left included as it is a great benefit to helpdesk support staff.
Click Next. TCP 80 and 443 are opened automatically in Windows Firewall.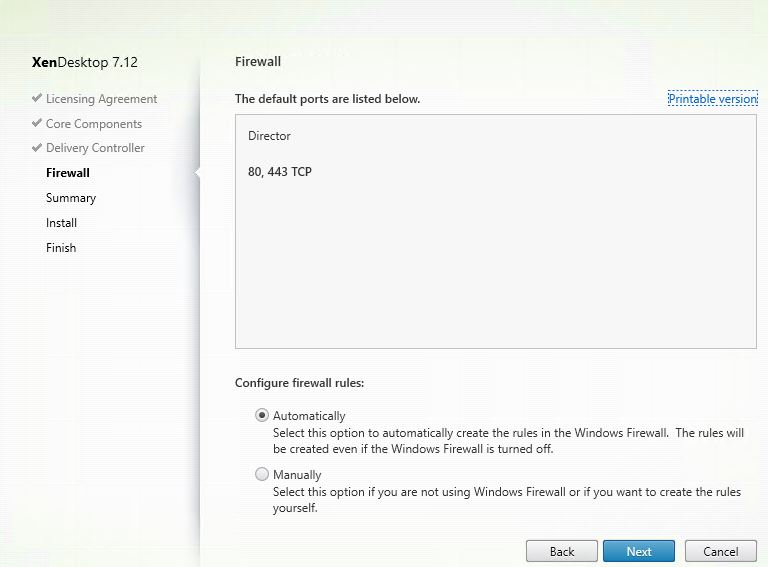
Click Install.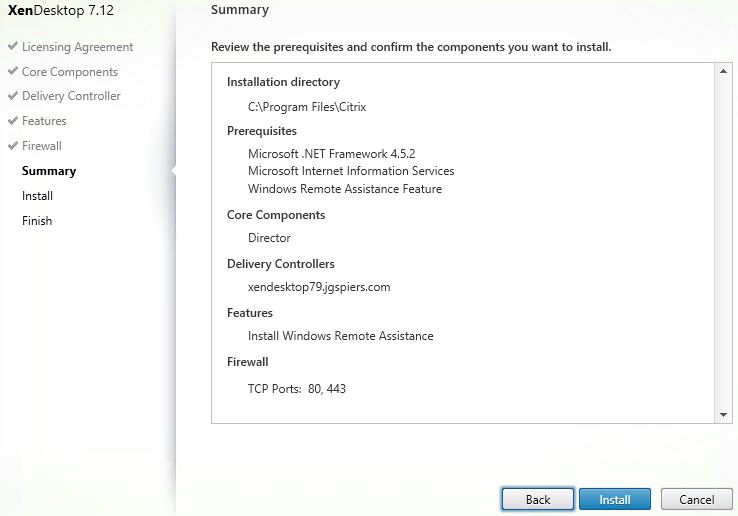
Director is installing.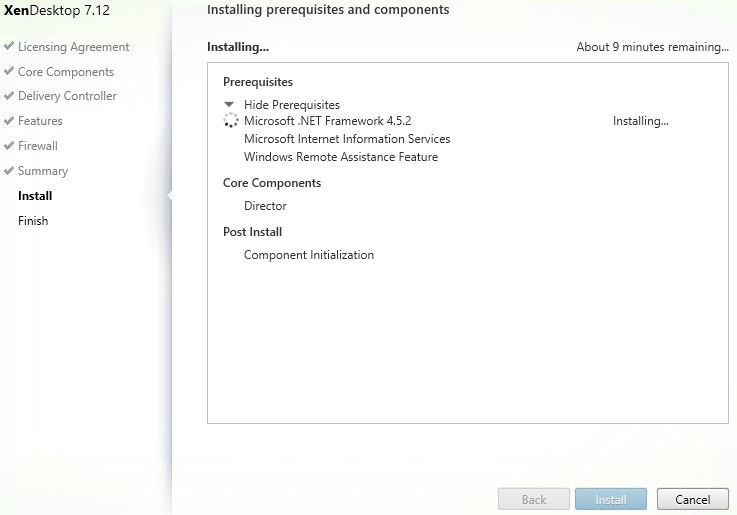
Click Finish. Director will launch but connect by default over HTTP. We ideally want to secure communications using HTTPS.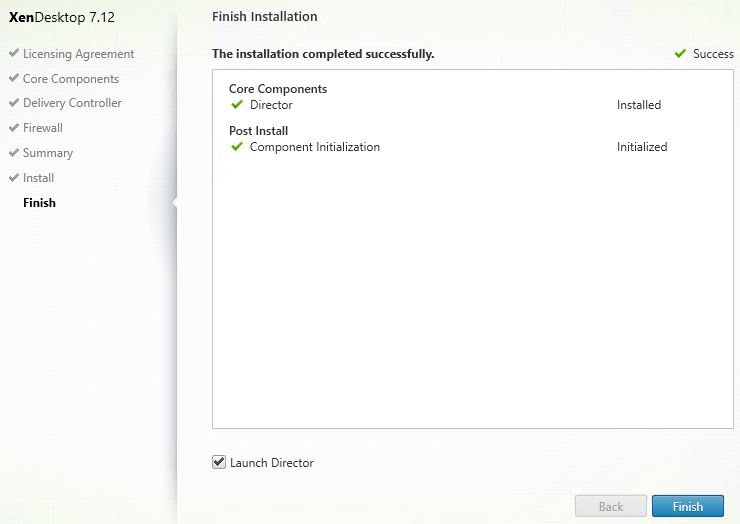
Generate a certificate that matches the Director FQDN. This will usually be a load balanced address if you use NetScaler Load Balancing. Open IIS on each Director server, add the HTTPS binding to the Default Web Site and select the correct certificate.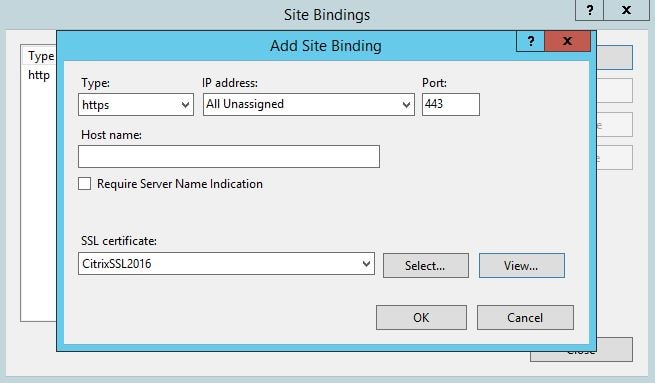
Now you will be able to connect to Director over HTTPS. Ensure you do not get any certificate warnings or erorrs. The domain field can be prefilled and made non-editable, to see how to do this read https://jgspiers.com/tweaking-citrix-director-dash-of-monitoring/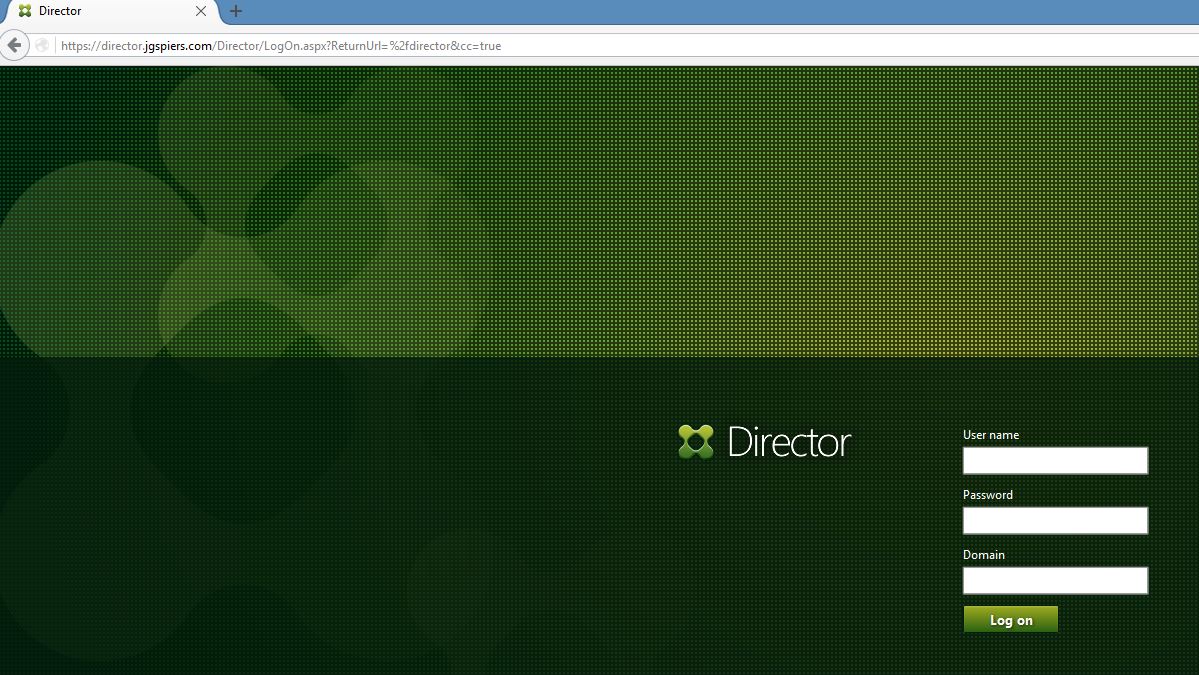
This completes the install of Citrix Director. The rest of this blog post will be around configuring Director post-install and using Citrix Director to monitor and troubleshoot your environment.
Director real-time monitoring
There is a lot of information gathered in real-time that Director feeds through to the console that will help an administrator identify issues within a Citrix Site. This information assists with troubleshooting connection failures, troubleshooting machine failures, investigate/troubleshooting active session issues and so on.
On the main dashboard pane you have several sections each with data for different parts of your Citrix farm. Towards the bottom you have the status of each hosting connection configured within your site under Infrastructure. You can configure thresholds which trigger alerts such as for high CPU usage on the hosts. This displays an alert in Director. More information here https://jgspiers.com/tweaking-citrix-directory-dash-of-monitoring/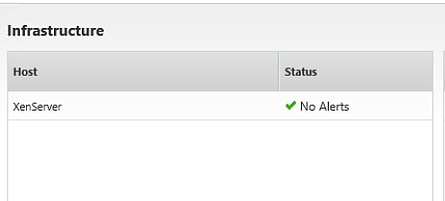
To the right of Infrastructure is the status of each Delivery Controller in your site. This section tells you if each Delivery Controller in your site can contact the License Server, Monitoring Database, Configuration Logging Database and that there are no service alerts etc.
If a Delivery Controller loses contact with the License Server for example Director displays a red alert such as below. If you hover over the Not Connected text it will give you some more information on what is wrong.
An alerts displays towards the top of the dashboard pane which explains what is currently at fault. In this instance, the License Service or Vender Deamon is down with recommended remediation steps.
Director shows alerts when machines fail or users fail to connect to a session on the main Dashboard page. As you can see below, 2 connection failures were recorded over the last hour. You can click the orange text to find out more information.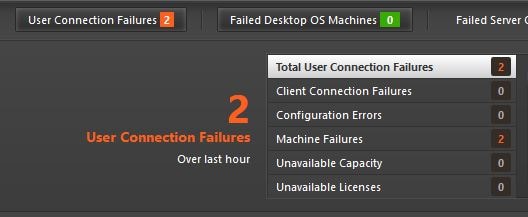 Two user connection failures occured from my own account. The failure reason is recorded as Registration Timeout. Failure reasons have been made more “user friendly” and informative in Citrix Director 7.12.
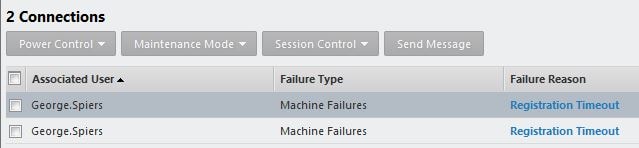
If you click on the failure reason blue text, you get some additional information and some recommended actions to resolve the connection failure. This is new to Director 7.12.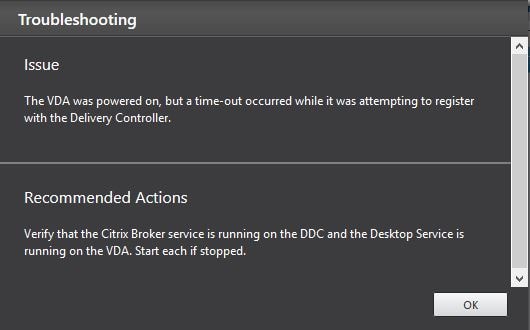 Another example connection failure reason. “Unavailable Capacity/No Machine Available”.
![]()
The troubleshooting information notes possible causes.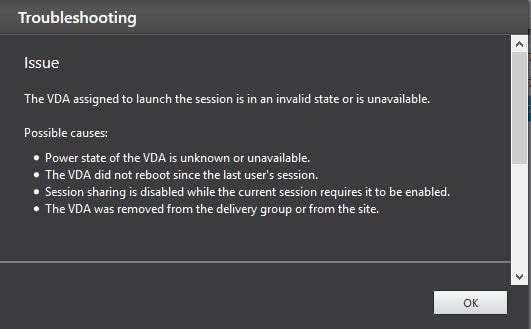 Some recommended actions are also supplied.
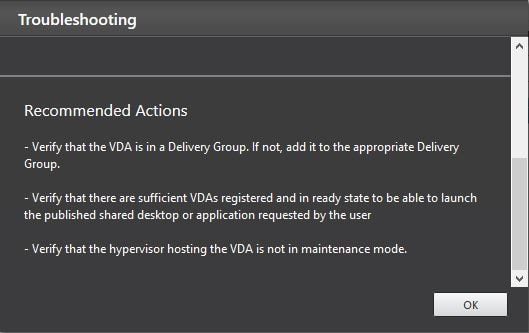 Like user connection failures, if a VDA fails for any reason the Dashboard screen shows an alert. Click the orange text to get a view of which actual VDA has failed.
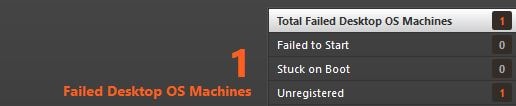 In this instance a VDA has failed due to Contact Lost. Click the blue text for more information.
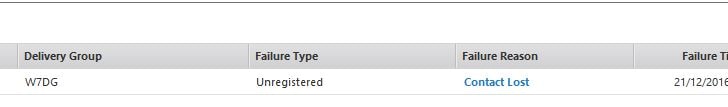 The issue reports that the VDA lost connection with the Delivery Controller.
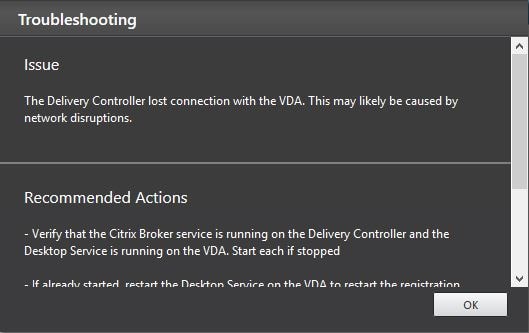 Some recommended actions such as restarting the Citrix Desktop Service is given.
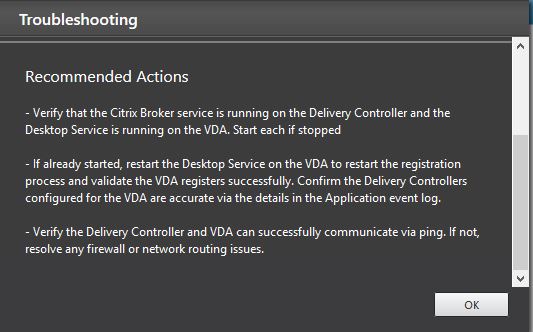
Asides from alerts, Director shows how many active sessions there are in real-time and the average logon duration over the past hour. If you are experiencing slow logons, compare the logons to previous acceptable times. Also investigate what portion of the logon process is at fault for example GPO or Login Script processing. Think about what has changed such as new application installs or Group Policy changes, or even how large the users profile is as these can all affect logon times. See https://jgspiers.com/digging-in-to-citrix-logon-process/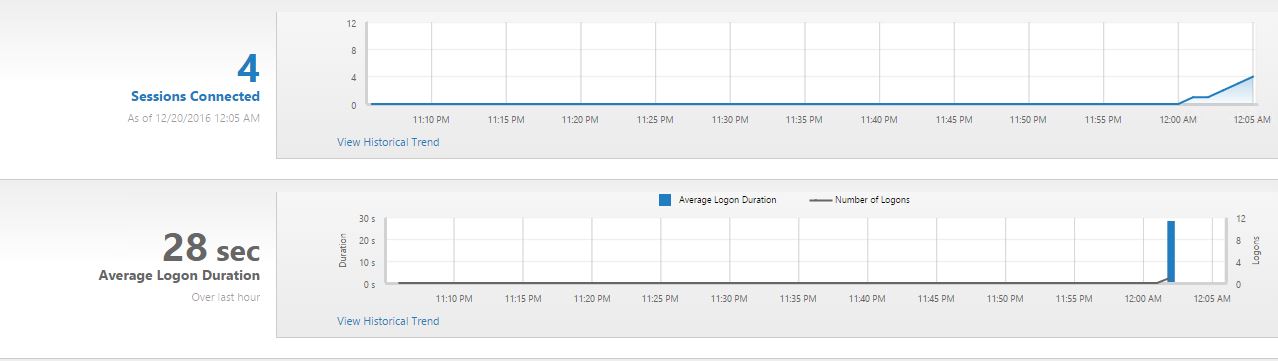
If you click on the blue Sessions Connected text you can find out who exactly is actively logged on. Some useful information such as username, endpoint IP, Citrix Receiver version and so on are recorded. If you click a username you can see more information specific to that user.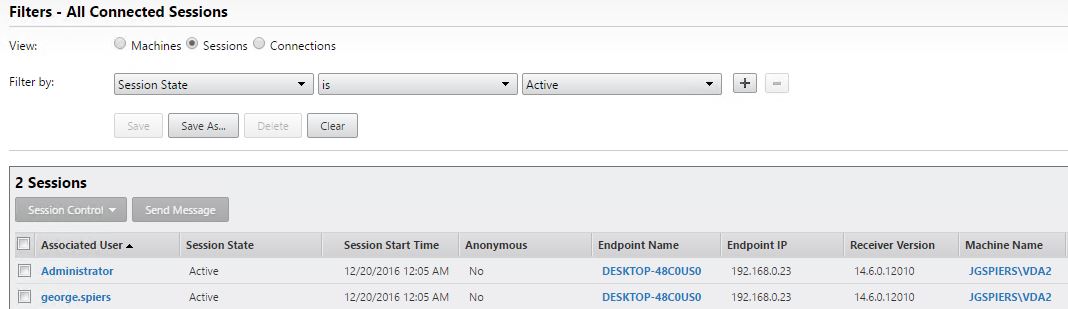
After clicking on an active user Director shows you a lot more user specific information and allows you to perform management of that session. Notice you can log the user off, shadow and see which applications and processes are running. You can also reset the user profile if Citrix Profile Management or Roaming Profiles are used.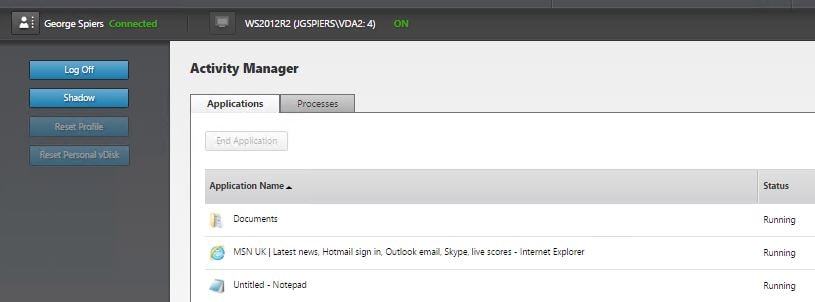
Having a closer look at the running applications we can see that Internet Explorer is running. If a user had reported that Internet Explorer had frozen and they couldn’t close it, you could come in here to select the Internet Explorer and then select End Application. This will end the Internet Explorer instance for the affected user only.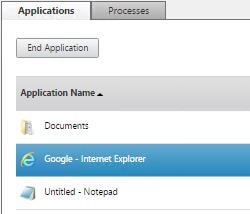
You can drill in to the processes by clicking on the Processes tab. This allows you to see what processes are running and end processes. You can also sort processes by CPU and Memory usage so that if a user reports a sluggish session you may find a certain process is consuming too much resource and end that process.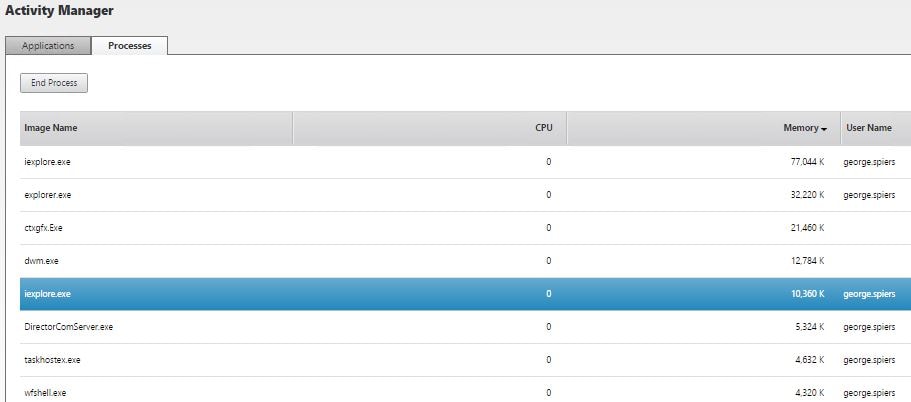
To the top left of the screen you can see which user you are currently viewing the session of. If you click the username, you see information such as phone numbers and locations. This could be helpful during troubleshooting for when you need the users location or contact number.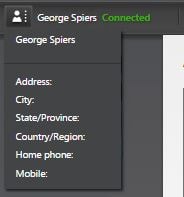
As mentioned before you can log the user off, shadow them or reset their profile and personal vDisk.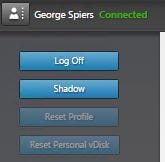
Click the Details button to the right of the screen.![]()
The Activity Manager section shows the same processes we viewed on the actual Activity Manager pane. Here again you can view processes, applications and manage them.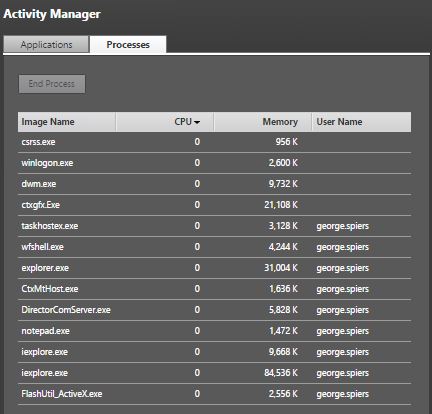
The middle section shows Machine Details, that is, VDA specific details. Here you can see the VDA name, Machine Catalog, VDA IP address, VDA version, Memory, CPU, current load and much more. Very useful information. You can also put the machine in Maintenance Mode by clicking Maintenance mode. If your VDAs are power managed the Power Control button is available. If you are running XenDesktop VDI desktops you can use the Manage Users button which allows you to unnasign or assign users to and from persistent desktops.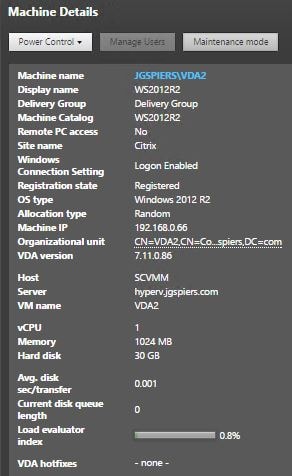
Power Control lets you restart, shutdown, suspend machines including the option to force these actions. If a machine was powered off you could power it on from here.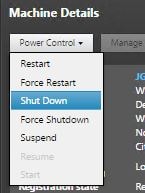
To the right of the Details view the Session Details portion allows you to see some user specific information such as Session State, endpoint name and IP, Receiver version, ICA RTT (screen lag) times and latency. You also have tabs for which Citrix policies are applying to the session and if any SmartAccess filters or hosted applications are configured.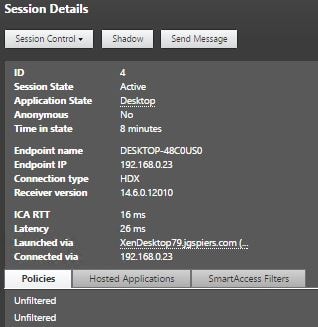
Session Control allows you to disconnect or log off a user.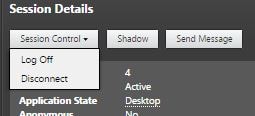
The Send Message button allows you to send a message to a user.
Type a message and click Send.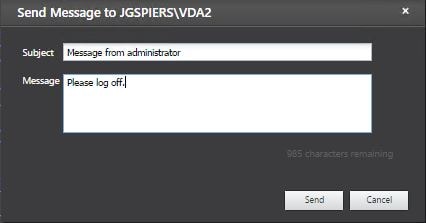
The message appears to that user only.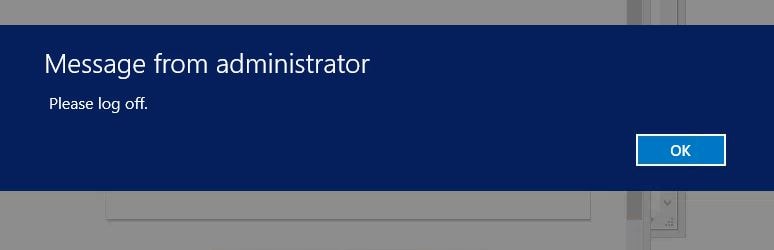
Towards the bottom of the Details view you can view the logon time for that user. This also shows a graph containing how long it took portions of the logon to process for example login scripts and brokering to process. You also get a comparison between this logon and logons for that same user for the past seven days or logon averages for the Delivery Group. If you are experiencing slow logons, compare the logons to previous acceptable times. Also investigate what portion of the logon process is at fault for example GPO or Login Script processing. Think about what has changed such as new application installs or Group Policy changes, or even how large the users profile is as these can all affect logon times. See https://jgspiers.com/digging-in-to-citrix-logon-process/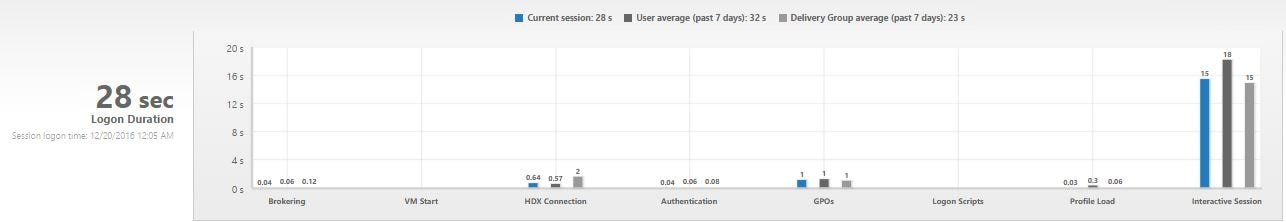
Underneath Personlization data relating to the users profile and personal vDisk display here. I do not have either Citrix Profile Management, Roaming Profiles or personal vDisks configured. If you did, you could see profile type, version, profile size and paths etc. with the options to reset them.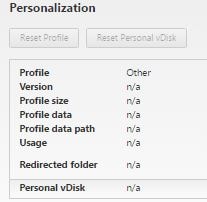
Under the HDX portion you can see which HDX virtual channels are in use and what resources they are consuming. For example, the Graphics Thinwire channel is currently running at 9FPS. The printing channel has 2 mapped printers and the channel is currently idle. You can click on virtual channels to get more specific information.
Using Director you can search for a user. Just click the Search button and start typing a username. Once the username is found click it and you’ll be given session information based on if the user is connected or not.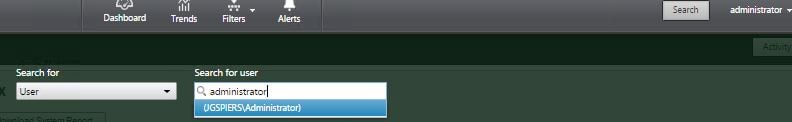
You can also search Machines (VDAs) by changing the Search for parameter to Machine. Start typing a VDA name and then select the VDA.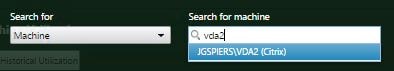
From here you get Machine Details seen before in the Details section of a users session. You can also Power Control and place and VDA in maintenance mode etc.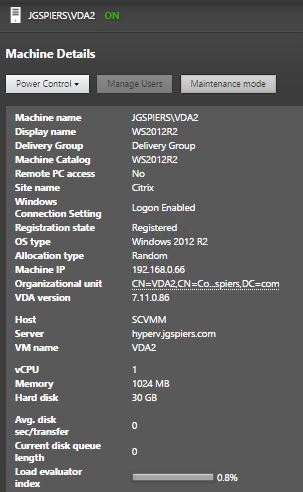
You also get a report under Machine Utilization showing the CPU and Memory usage within the last minute. The number of sessions currently active or disconnected on the VDA are also shown. This feature was released in Citrix Director 7.11.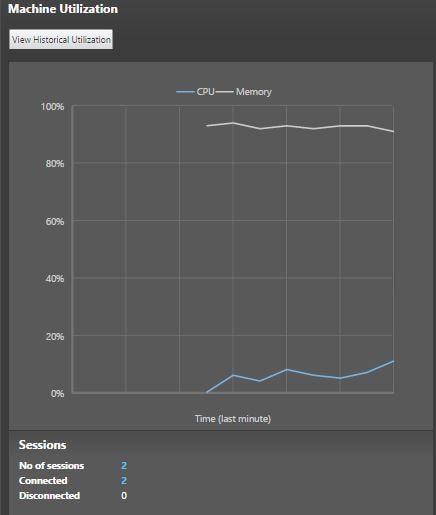
In Citrix Director 7.14 you can view Average IOPs, Disk Latency and GPU (if applicable) along with the existing metrics for CPU and Memory utilisation.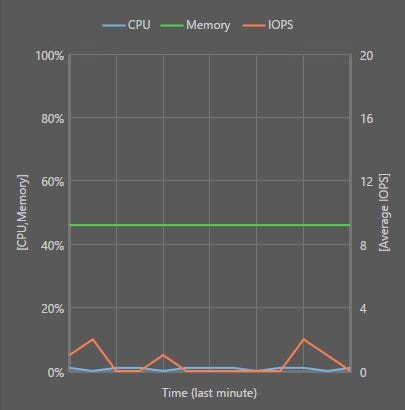
The Hotfixes pane below will report any Citrix hotfixes that have been installed on the VDA.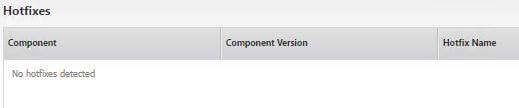
If you click the View Historical Utilization button underneath Machine Utilization you can get historical machine consumption information. This is new to Director 7.11.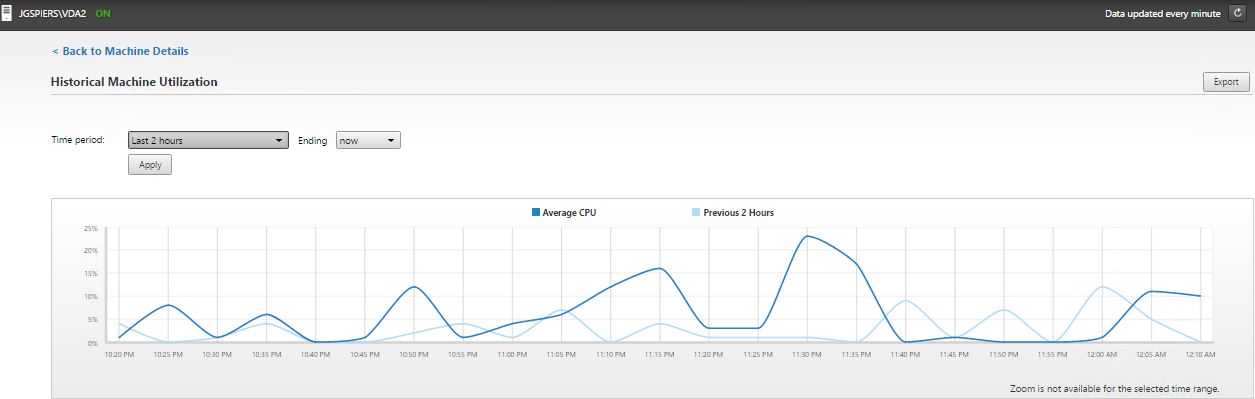
Changing the time period is possible from 2 hours to 24 hours, 7 days, one month or the past year.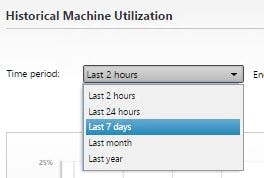
The historical machine utilization shows memory, CPU and session data for that machine. This can be useful for comparing the resource consumption and usage of a VDA a month ago vs. now to see how much more machines are being used for example. 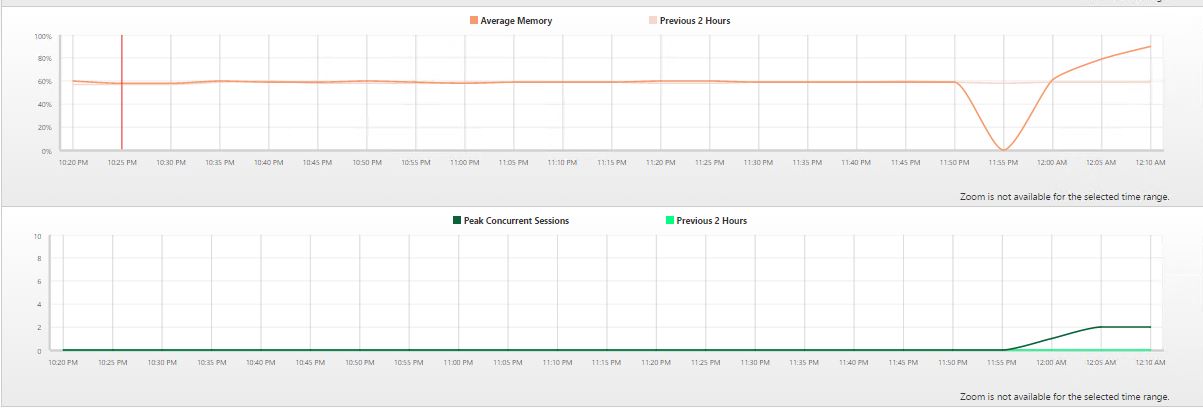
Click the Export button.
You can export the utilization report.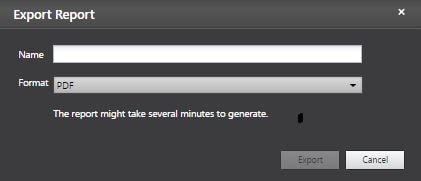
You can export to PDF, CSV or Excel format.
Note: I generally recommend CSV as you tend to get more data out of the export than the other options.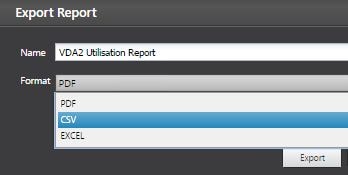
The report will generate and then download to your machine.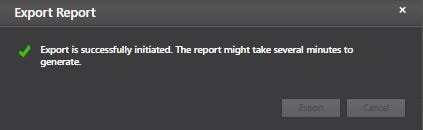
Here you can see a sample utilization report.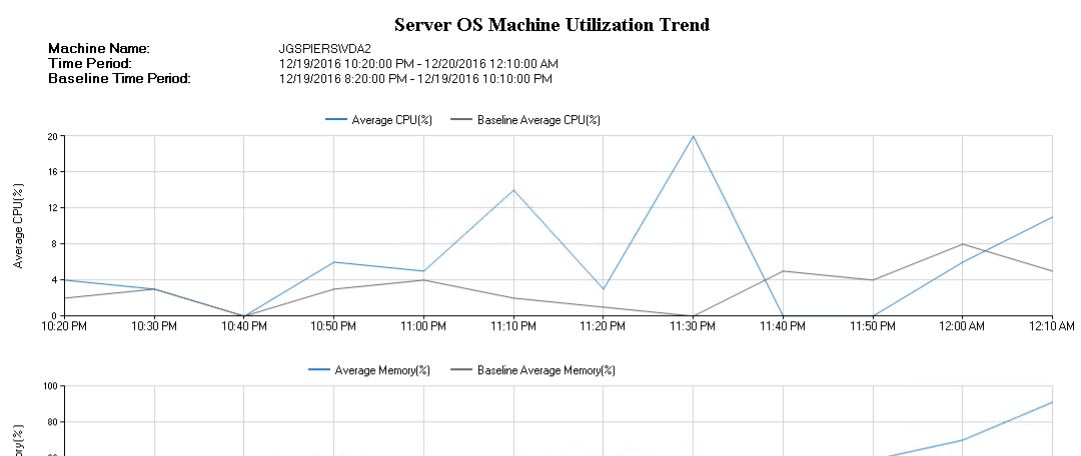
In Citrix Director 7.14 Machine Utilisation has been expanded to report on Average IOPS, Disk Latency and GPU (if applicable). Each metric you want to view are available as check-boxes.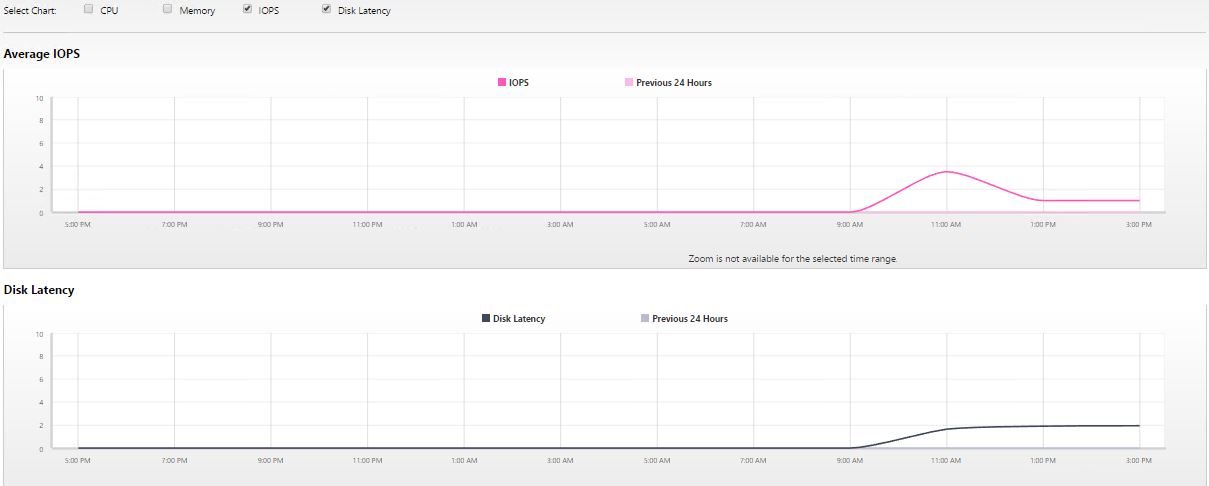
The top 10 processes on a VDA are also tracked and recorded within Director if you have process monitoring enabled. If you look at a machine’s historical resource utilization towards the bottom is the Top 10 Processes section. Notice it is disabled as you must enable the policy using Citrix Studio.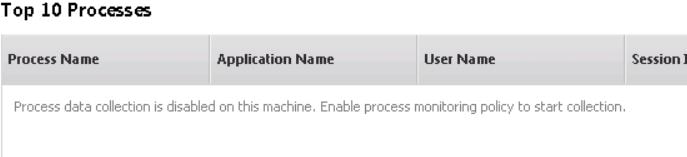 Set Enable process monitoring to Allowed.
 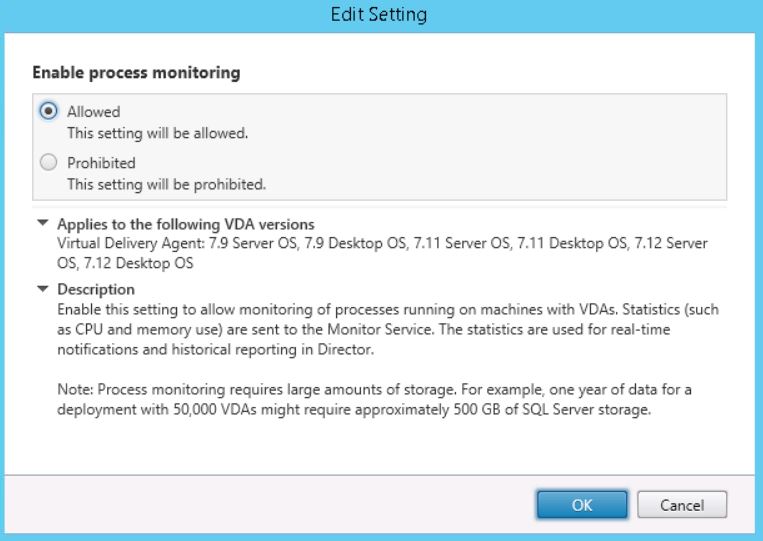 Process information will start to gather. You can click any of the top 10 processes to view historical memory and CPU consumption.
 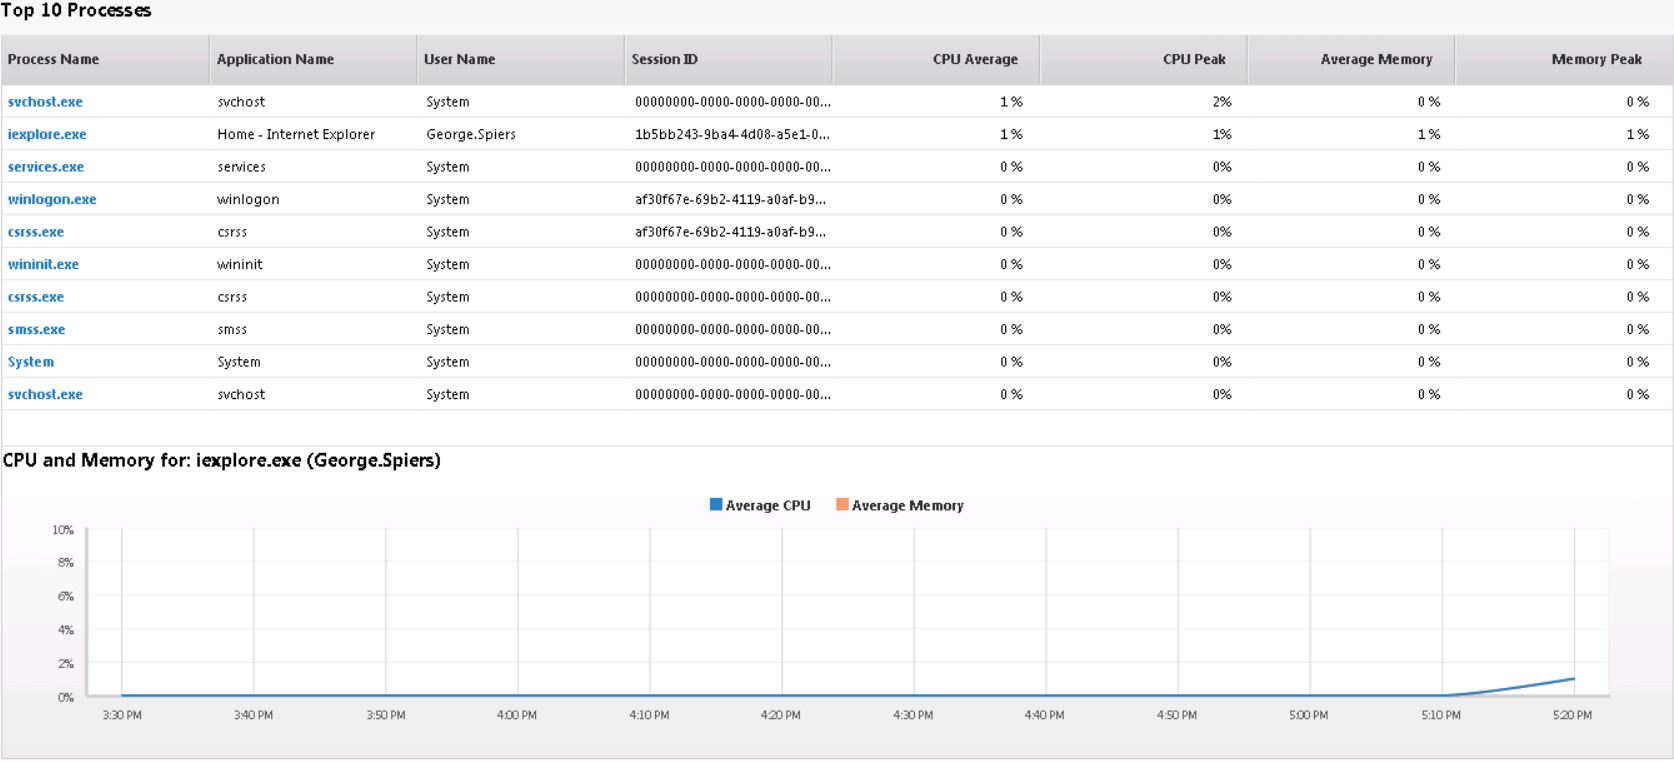 Note: If you do not wish to track process information amd/or CPU/memory/IOPS resource consumption then turn off these policies as it will eliminate unnecessary processing and resource consumption.
Note: CPU and Memory statistics are received by the monitoring database every 5 minutes and kept for 1 day before being archived. Having 1k VDA machines approximates to around 253MB consumed storage on the database for CPU and memory data.
Note: IOPS statistics are received by the monitoring database every hour and kept for 3 days before being archived. Daily IOPS data is kept for 90 days. Having 1k VDA machines approximates to around 270MB consumed storage on the database for IOPS data.
Note: Process statistics are received by the monitoring database every 10 minutes and kept for 1 day before being archived. Having 1k VDA machines approximates to around 1.5GB for Desktop OS VDA or 3GB Server OS VDA consumed storage on the database over a period of a year.
Note: You can reduce the default retention periods to achieve more accurate process utilisation data, but this would consume extra storage.
Director trends and historical data
The Trends section of Director is generally used for historical lookups on sessions, session failures, machine failures, log on times and so on. You can see these types of data over periods of time which is helpful for comparing data now versus historically. By default trend data is available for 365 days when you have a Platinum license, 31 days for Enterprise and 7 days for Standard licenses. You can also export historical data and create custom reports. Custom reporting is new in Director 7.12 for Platinum customers.
The Sessions tab displays currently running, disconnected and historical sessions from the past 2 hours, 24 hours, 7 days, 1 month or year. Again how far you can go back depends on the Director version and the XenApp/XenDesktop license you have. You can see session start and end times, session duration, peak connected sessions and so on.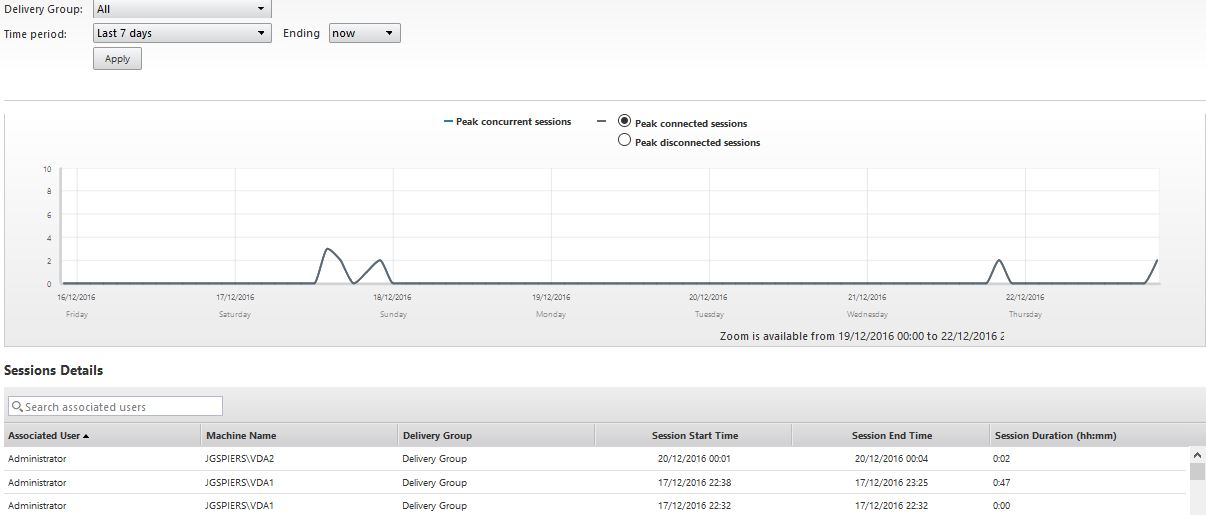
The below shows the time periods you can pick to view sessions.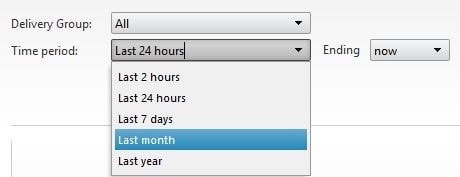
If using Director on an Enterprise license and a version lower than 7.12, you can only go as far back as 7 days.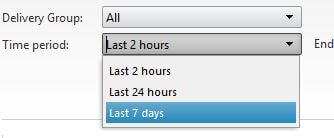
You can use the export button to create a report.
The report can be exported as a PDF, Excel or CSV file.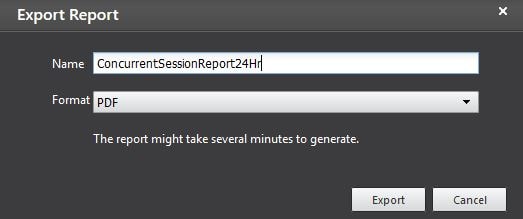
Here’s an example of a report generated from the sessions tab.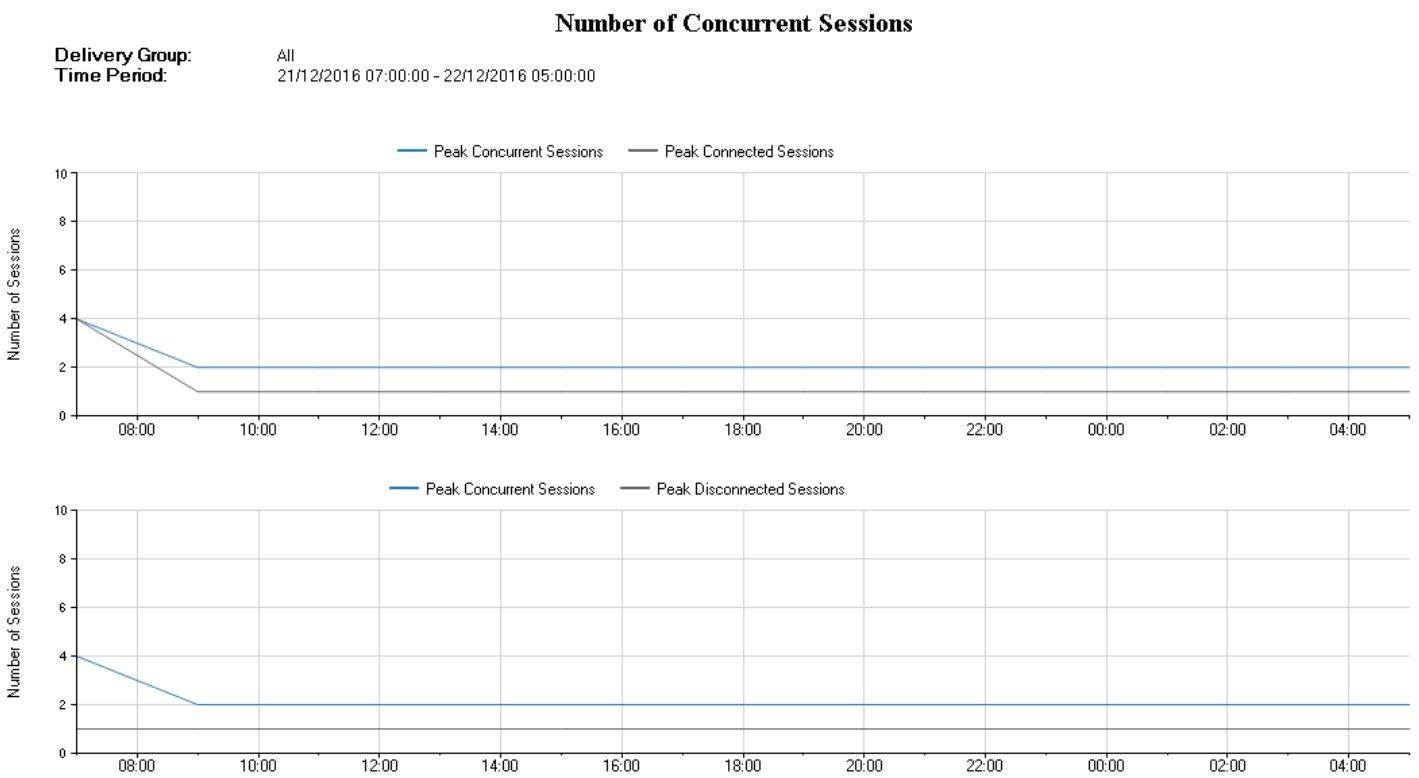
By default the PDF, Excel and CSV formatted reports all have a soft limit on how many records/rows can be exported from Director/SQL. This limit is to ensure system performance is not negatively affected during an export. The limits can be changed using IIS. The default limits are:
- PDF – 500 records supported.
- Excel – 100,000 records supported.
- CSV 100,000 records supported. 10,000,000 records supported from Sessions tab.
There are a maximum number of supported records as defined by Citrix:
- PDF – 5000 records supported.
- Excel – 100,000 records supported.
- CSV – 100,000 records supported.
Note: Setting a number higher than the maximum supported number defined by Citrix is not supported and can have adverse affects on performance of the Director server, SQL and Delivery Controllers during an export.
The Failures tab shows failed connections, failed desktop OS machines and failed server OS machines that occured over different time periods. Here you can see a couple of user connection failures, including the reasons and times, during the past 24 hours.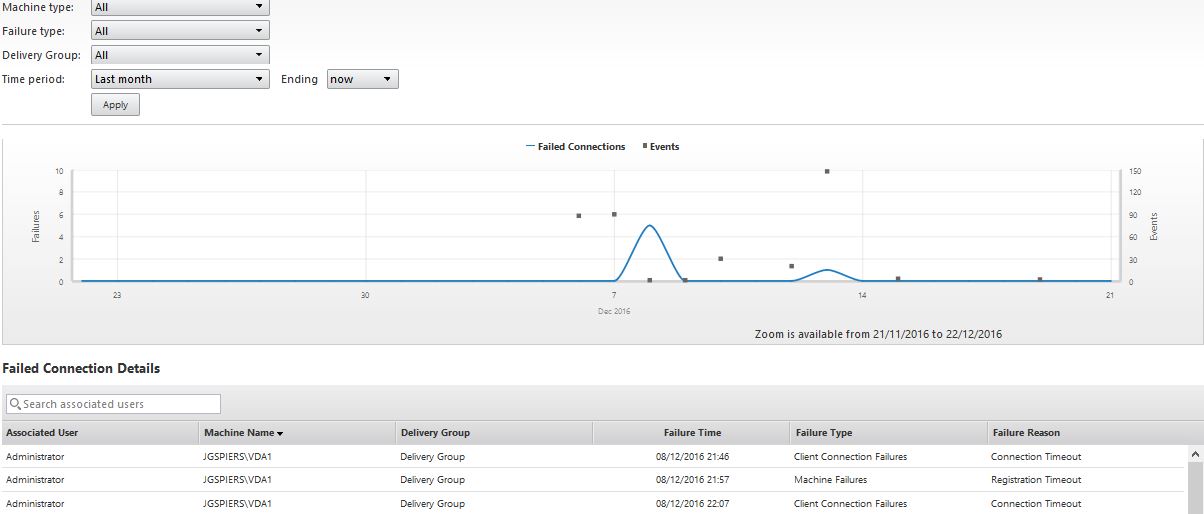
You can filter machine type to show only connected failures on server OS or desktop OS machines.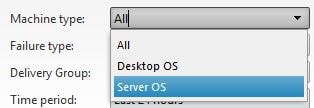
You can filter the results by failure type such as Client Connection Failures.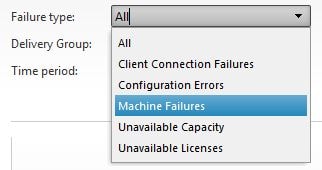
And you can filter by Delivery Group.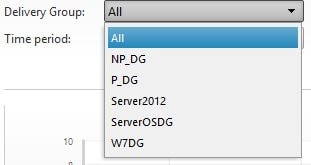
Here you can see I have filtered the results both by failure reason and the Delivery Group.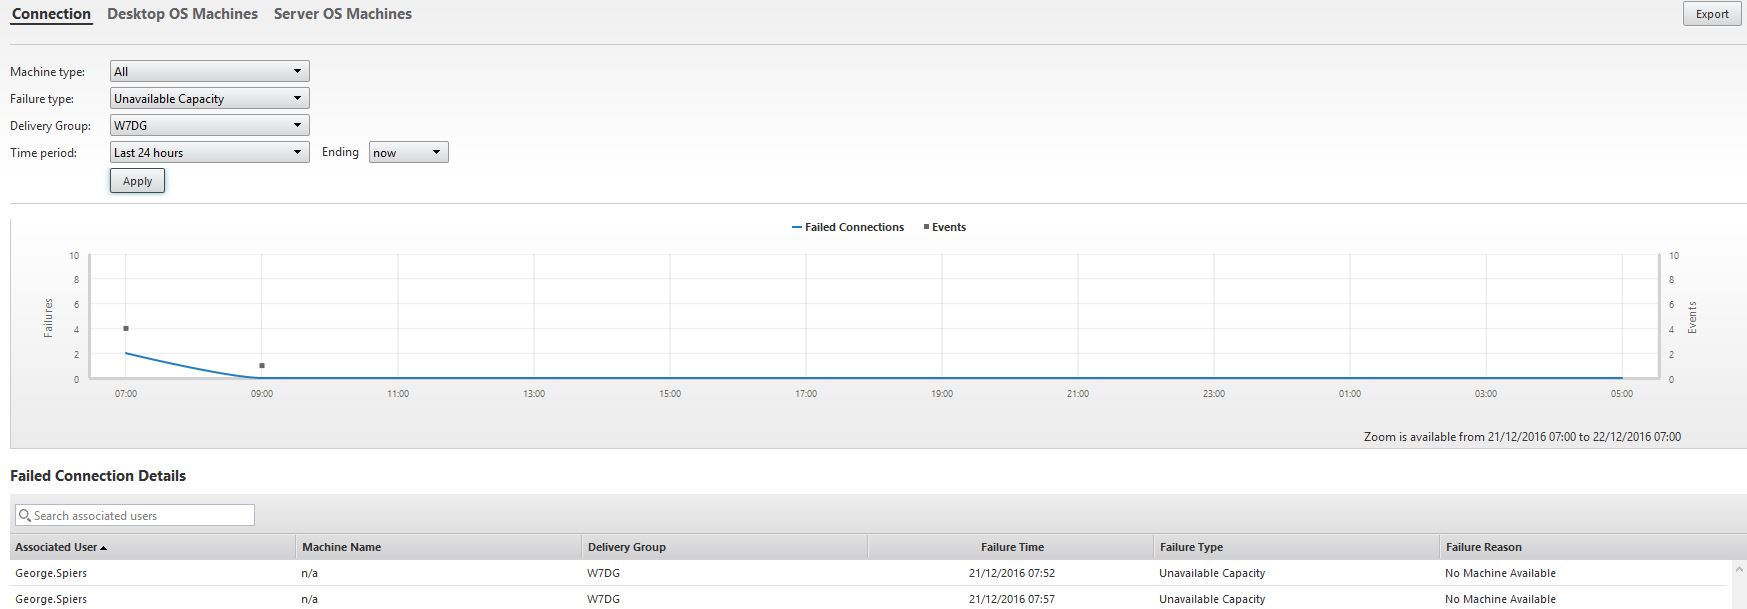
If you switch to the Desktop OS Machines panel you can see which VDA machines running desktop OS failed over the past 24 hours. The Desktop OS Machines panel shows the same.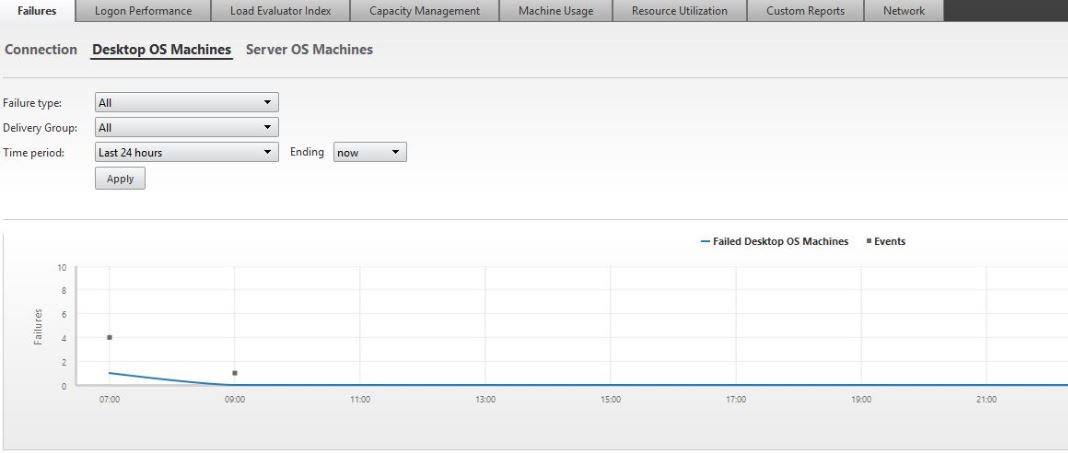
The Logon Performance tab shows logon performance, including logon times and usernames over specific periods of time. If you are experiencing slow logons, compare the logons to previous acceptable times. Also investigate what portion of the logon process is at fault for example GPO or Login Script processing. Think about what has changed such as new application installs or Group Policy changes, or even how large the users profile is as these can all affect logon times. See https://jgspiers.com/digging-in-to-citrix-logon-process/
See how Citrix Workspace Environment Manager can help reduce logon times by moving GPO tasks to WEM https://jgspiers.com/citrix-workspace-environment-manager/
Also for tips on reducing logon times see https://jgspiers.com/citrix-director-reduce-logon-times/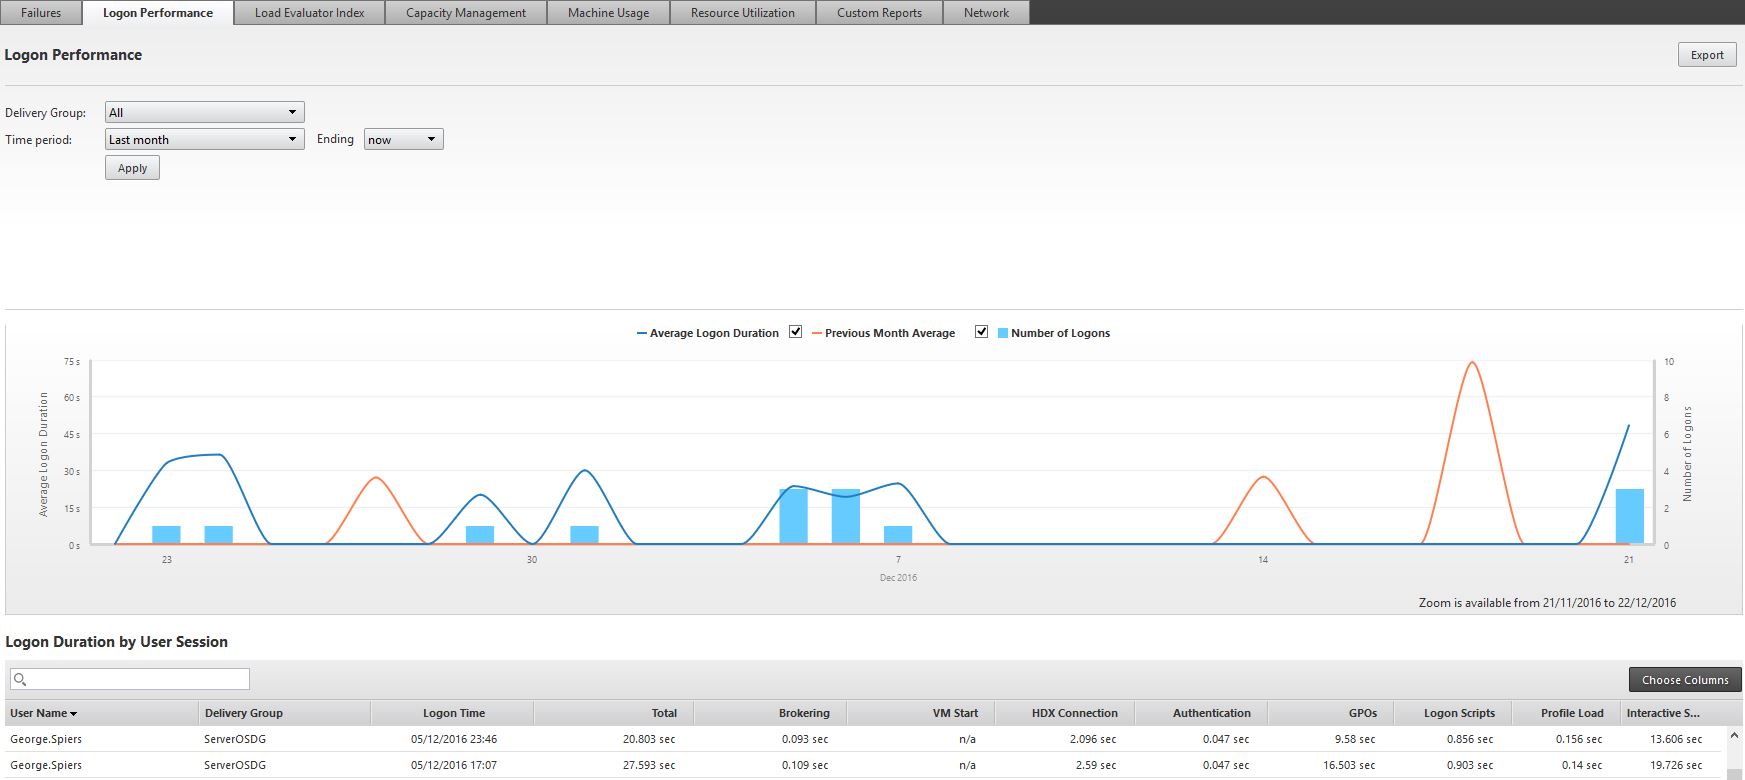
The Load Evaluator Index tab shows the Load Evaluator Index of all XenApp/Session Host machines within the Citrix site or machines within specific Delivery Groups. This metric helps you identify how much load is being placed on machines by sessions. Load is calculated by CPU, disk, memory usage and session count.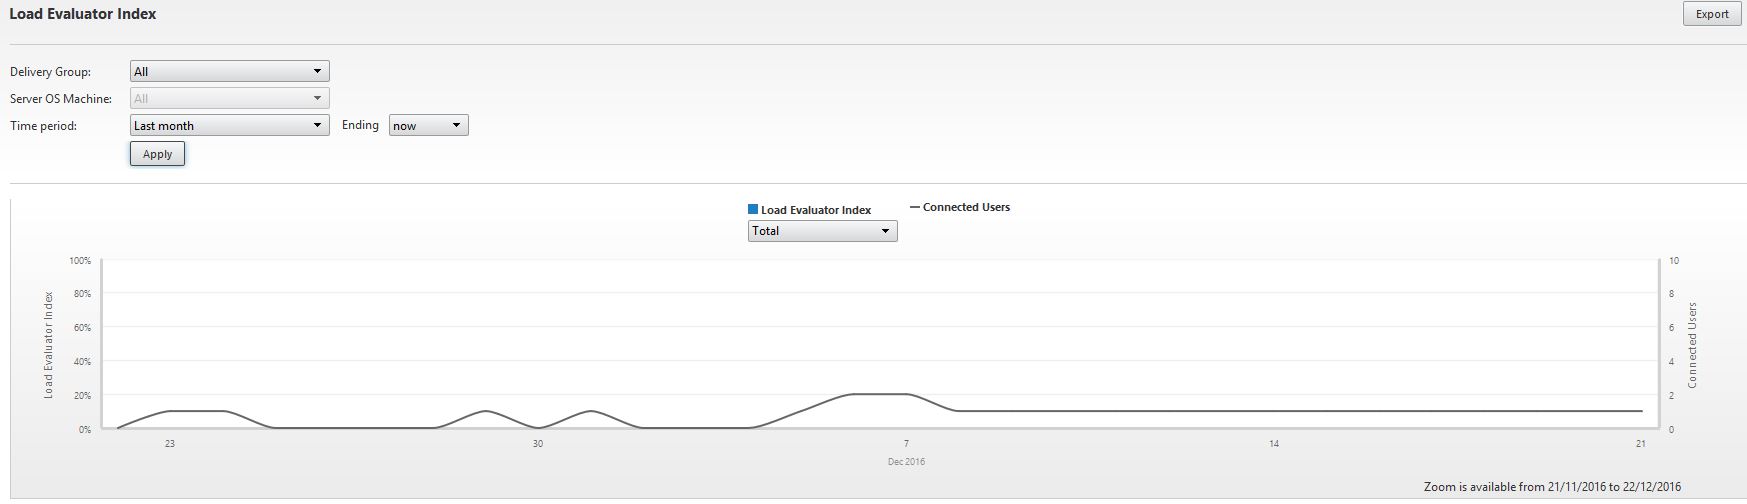
You can sort the graph by CPU, memory, disk and so on.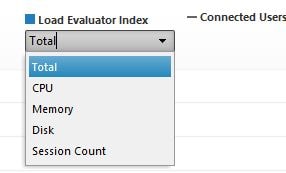
For more information on Load Index and how it is calculated, see https://jgspiers.com/vda-load-index-xenapp-session-load-balancing/
The Capacity Management tab shows application usage, desktop and server OS usage. Here you can see the amount of sessions including concurrent count for each application.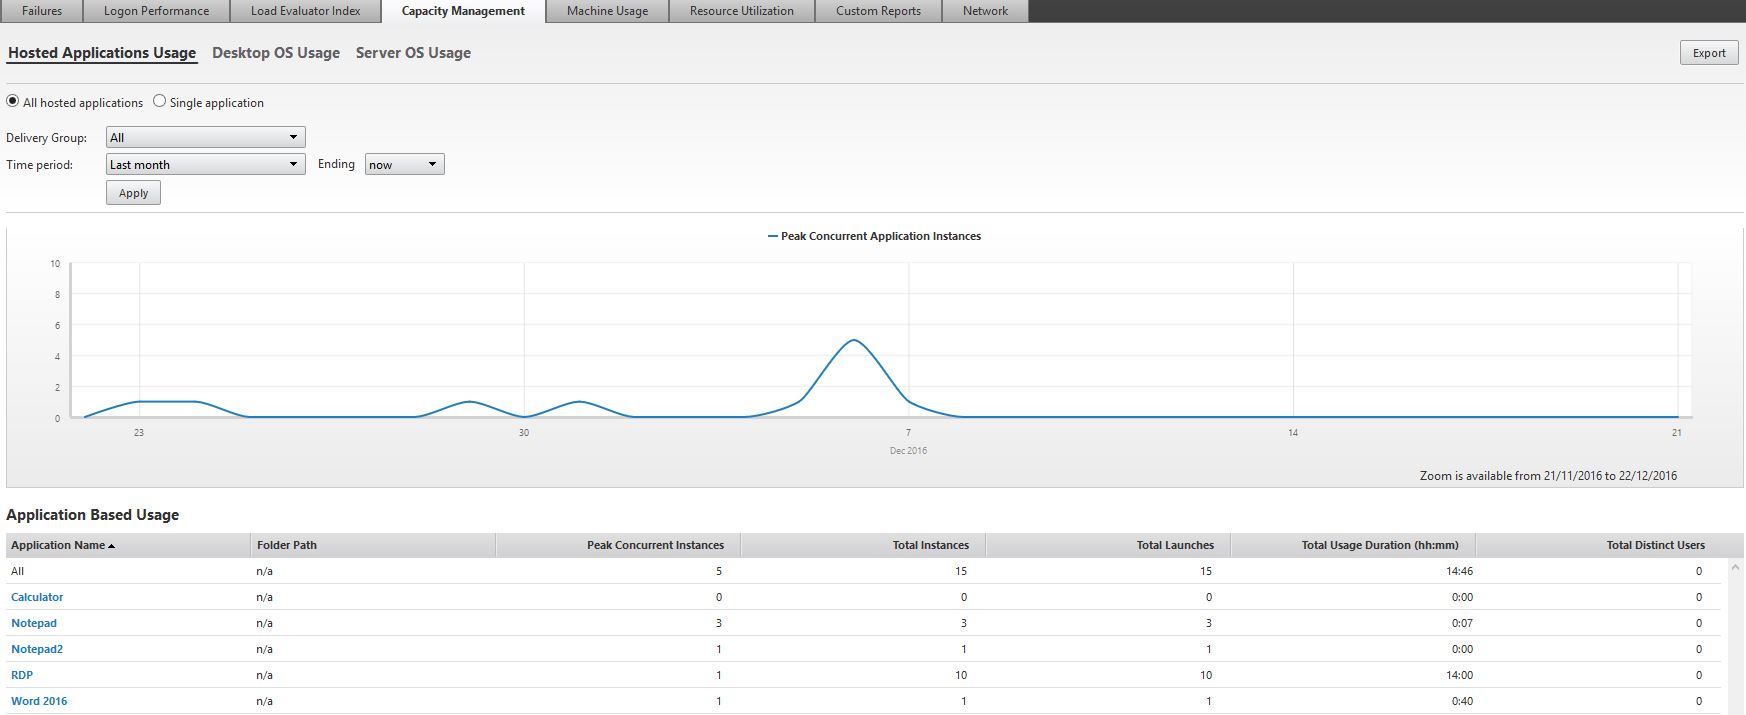
If you click on the Single application radio box you can search for specific applications to view usage data.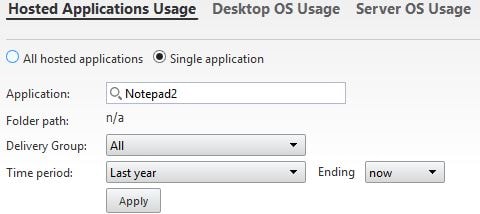
The Server OS Usage pane shows server OS usage. You can drill down to specific Delivery Groups or machines.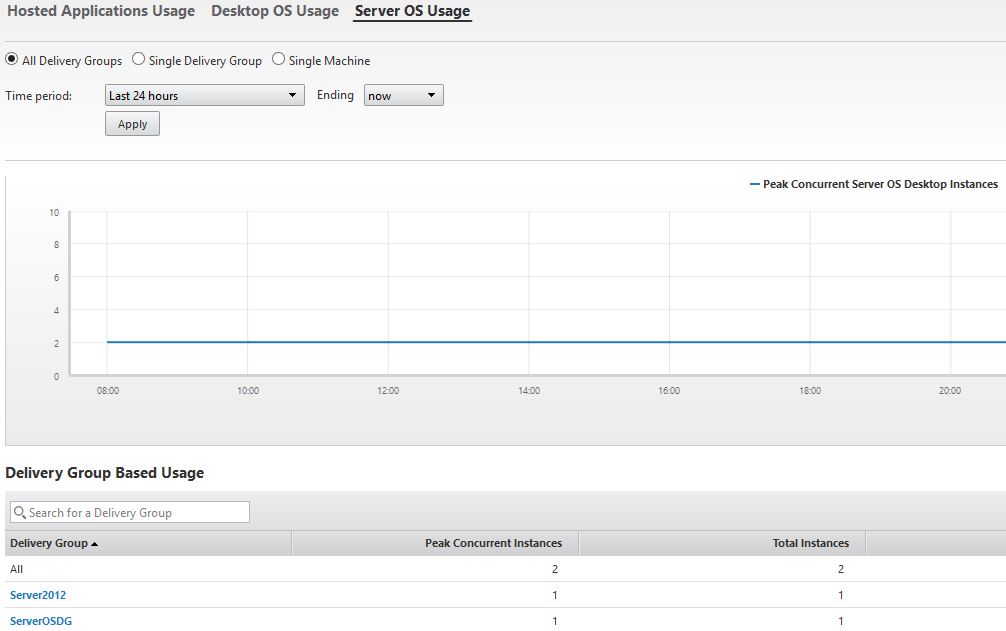 The Desktop OS Usage pane shows similar data for desktops.
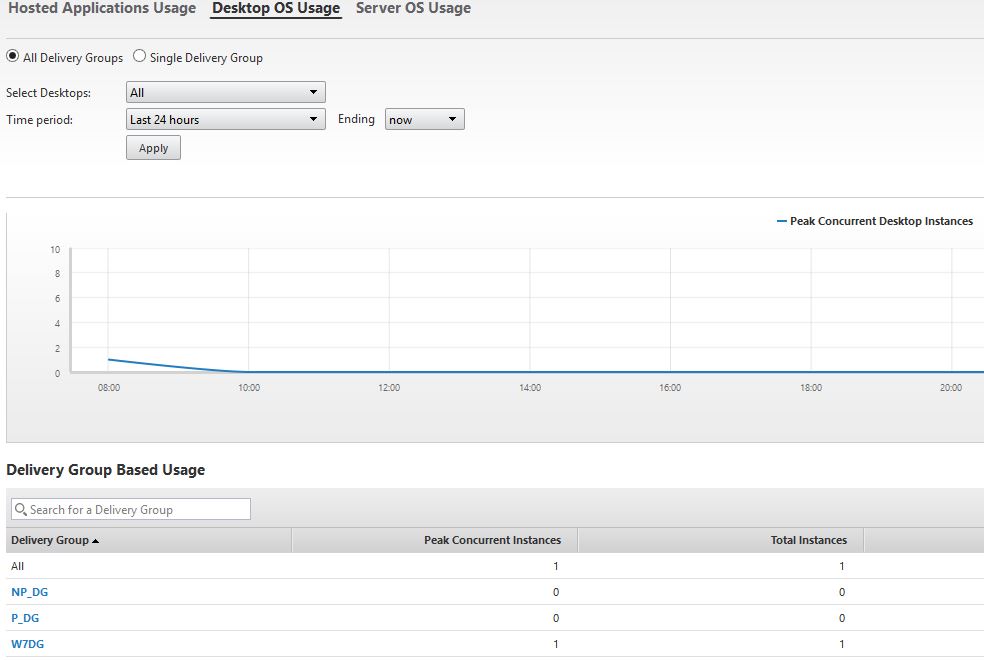
The Machine Usage tab shows desktop and server usage including how many VDAs are available, unavailable, unregistered or preparing.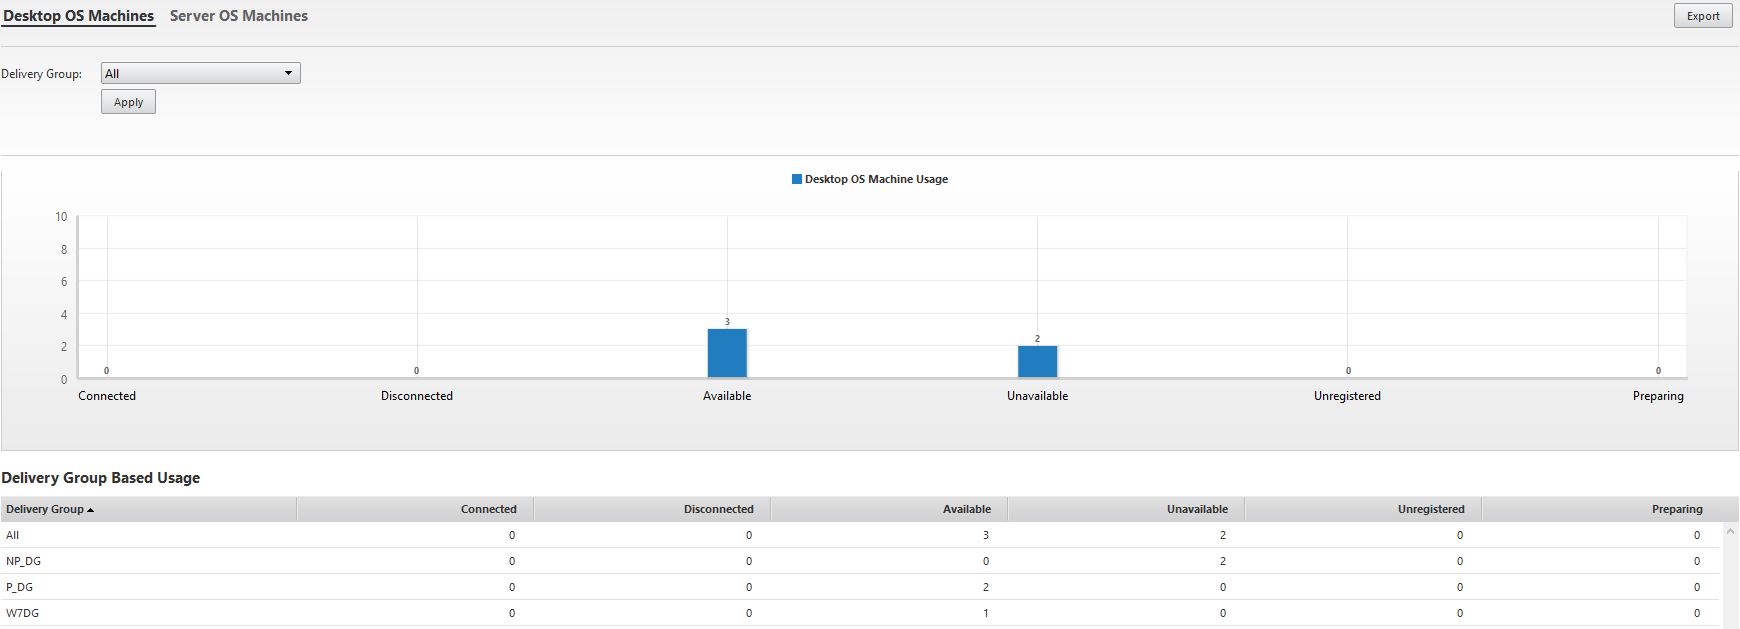
The Server OS Machines pane shows two server OS VDAs currently being used.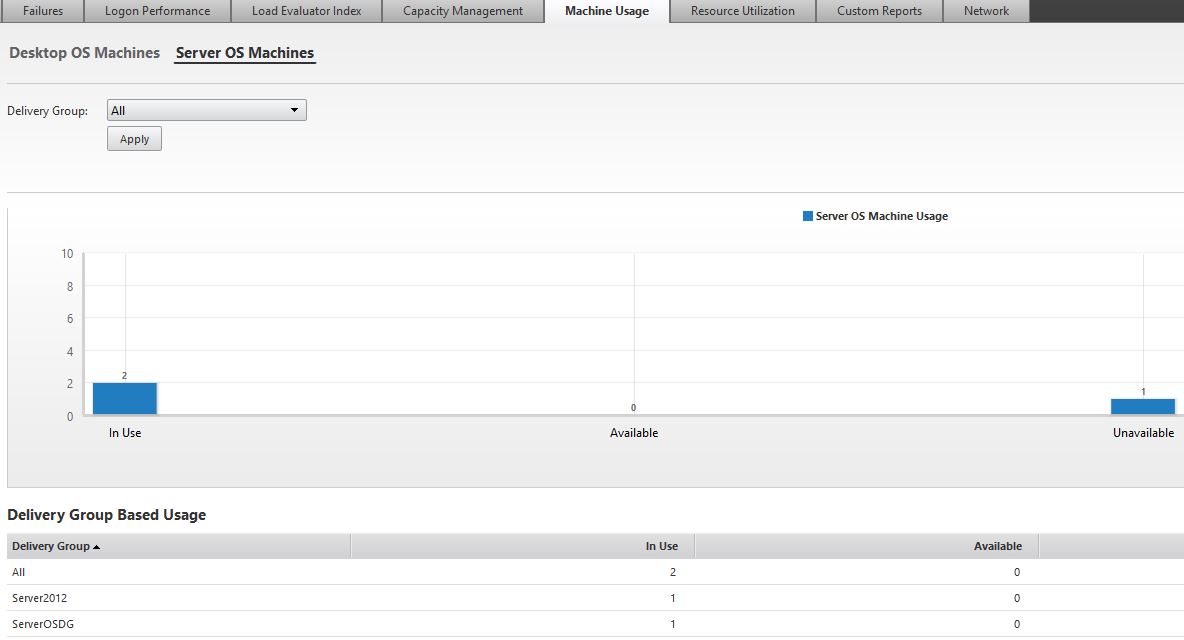
On the Resource Utilization tab you are given CPU, Memory and concurrent session statistics for desktop and server OS machines.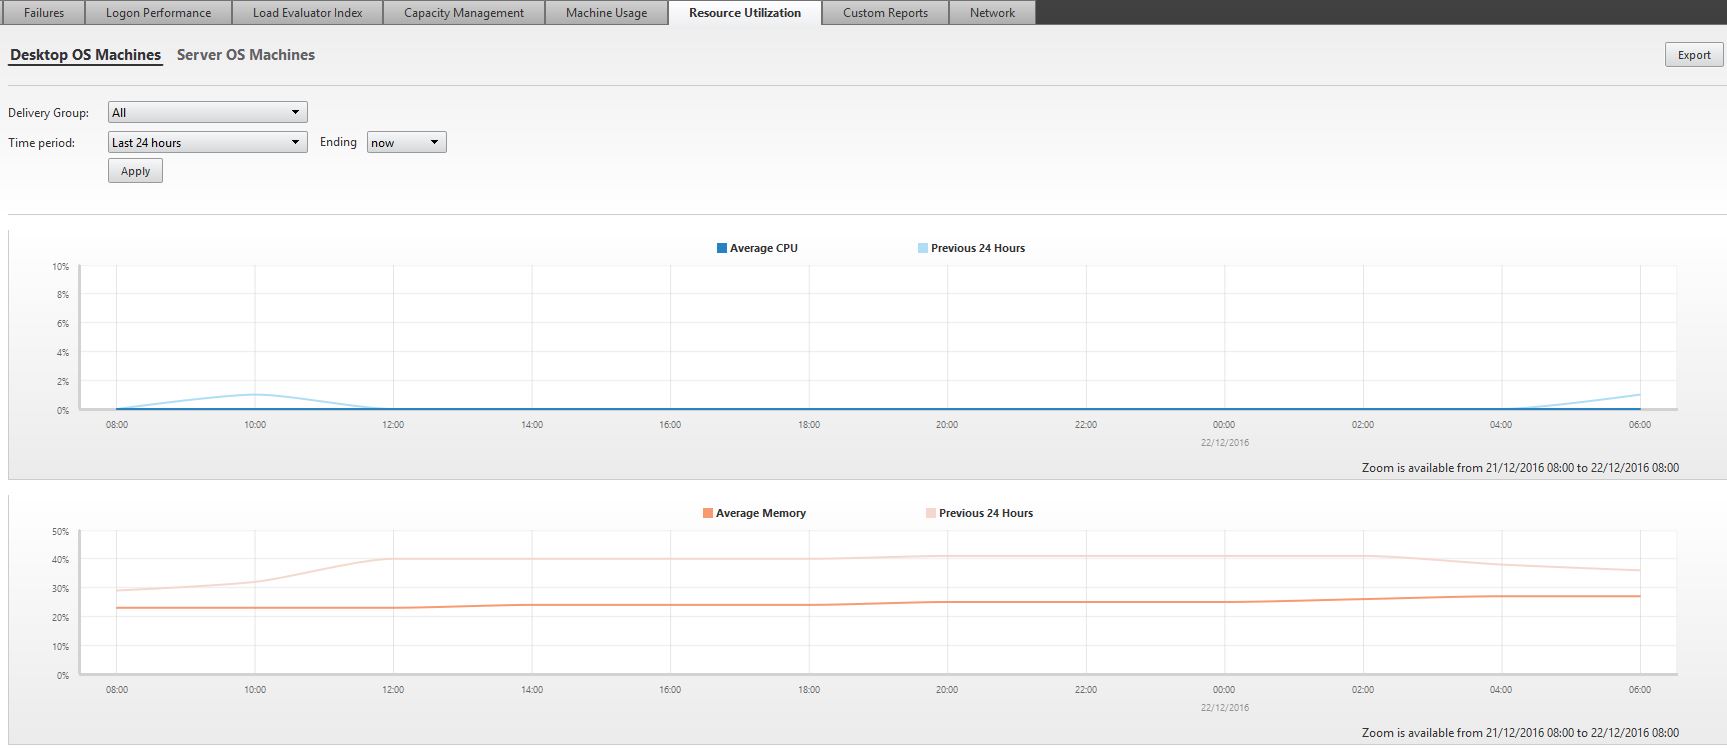
Custom reporting (new to 7.12 for Platinum customers) allows you to create an array of custom reports without having to build OData queries like you would have had to do with previous Director versions. On the Custom Reports tab, click Create Reports.
Note: Your Director server and DDC’s should be running under version 7.12.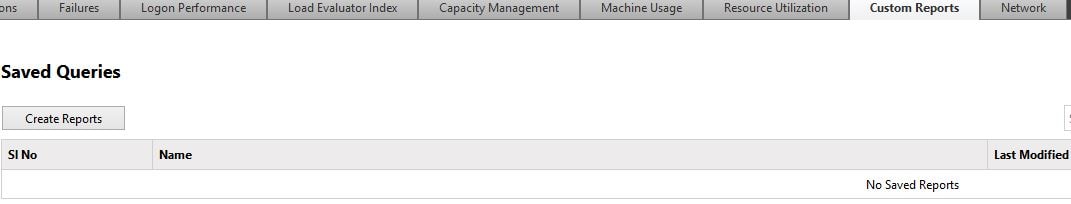
Underneath Custom Query you have a mixture of different variables you can use to create a report based on the information you need. In this example, I want to get a list of connections within the last 24 hours including VDA version, Receiver version, launch time etc. When you have designed the report the way you like you can preview the report before executing it.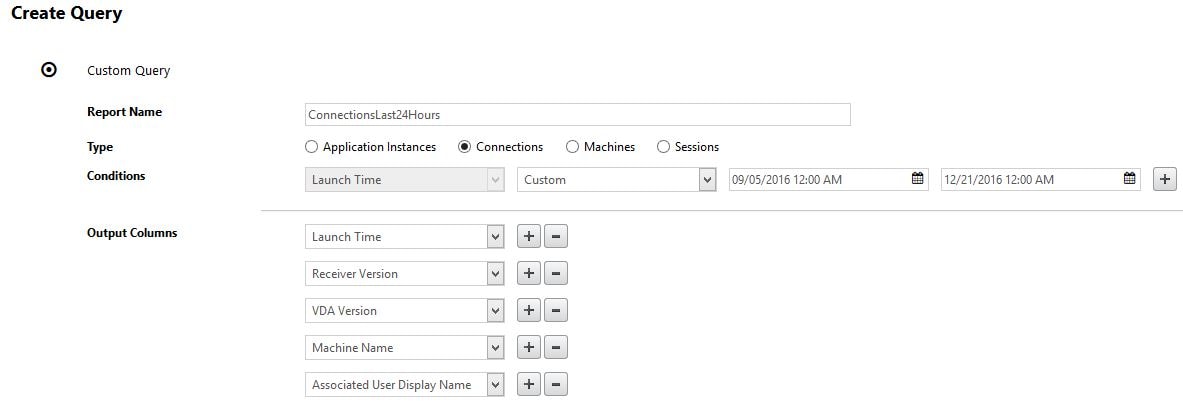
Click the Preview button.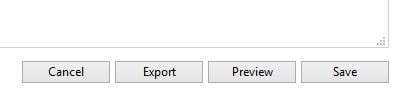
Preview is great as it allows you to continue editing the custom report until you have the exact the information you want.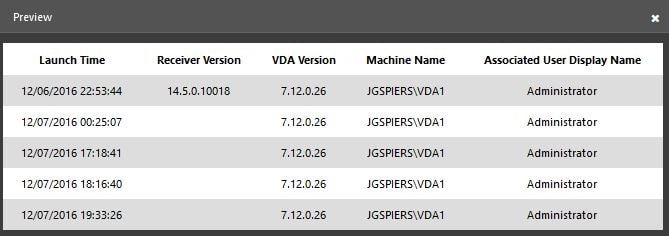
Click Export to export the report to CSV.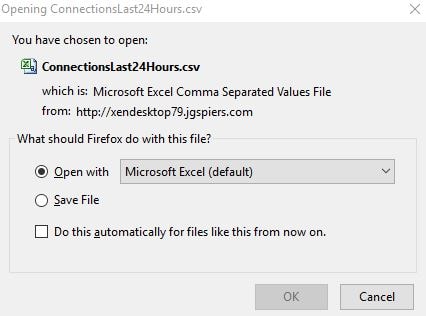
You can also save the report, and it now displays under the Custom Reports tab. Any time you want to run the report simply click Execute.
Director informs you that the report is being generated.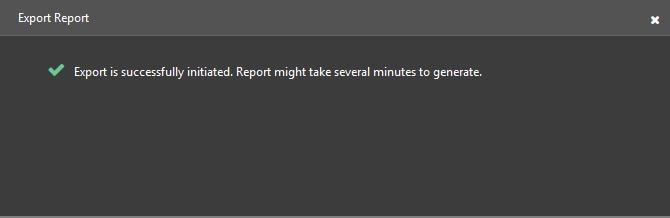
When the report generates you can open it using Excel and view the data.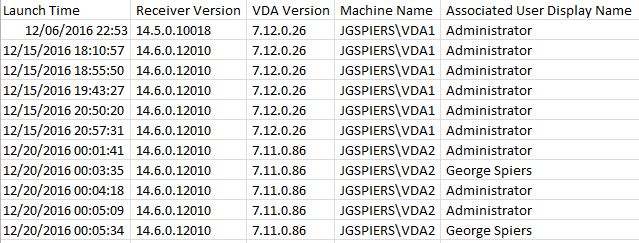
The Network tab is used for XenApp/XenDesktop Platinum customers who want to integrate AppFlow from NetScaler using NetScaler MAS in to the Director dashboard. MAS must be atleast version 11.1 build 49.16 and Director must be version 7.11+. To integrate MAS with Director see https://jgspiers.com/citrix-netscaler-management-analytics-system/#Director-Integration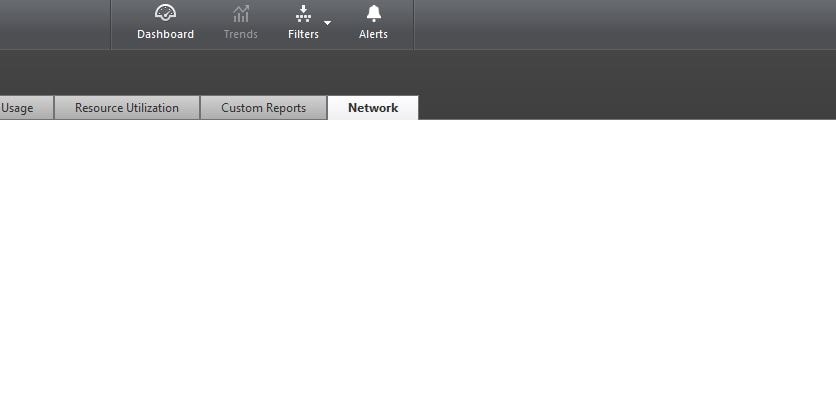
Citrix Director Filters
The Filters button allows you to quickly get a view of filtered data such as failed VDA machines due to the machines being unregistered, stuck on boot and so on.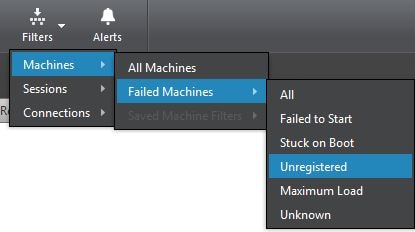
You can filter by sessions.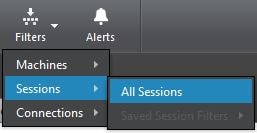
You can also filter by failed connections, or all connections.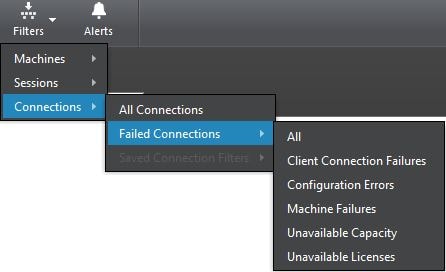
If you had clicked to filter all failed connections, that’s the information you get. Notice there are filter drop-downs allowing you to customise and further filter the data.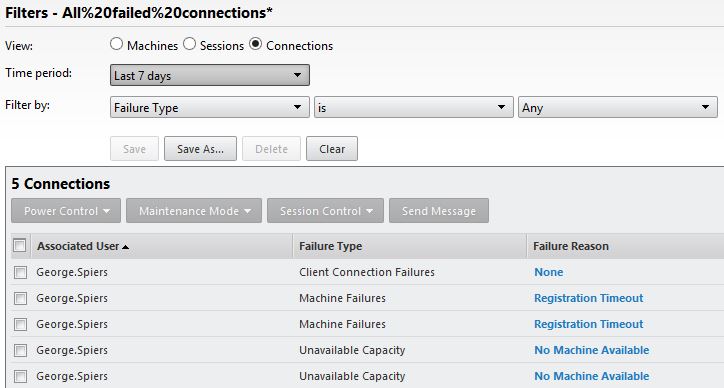
For this example I want to see failed connections against VDA 7.11 machines. You can save the filter and it will show up under the Filters button. This allows you to easily get the analytics you need on demand.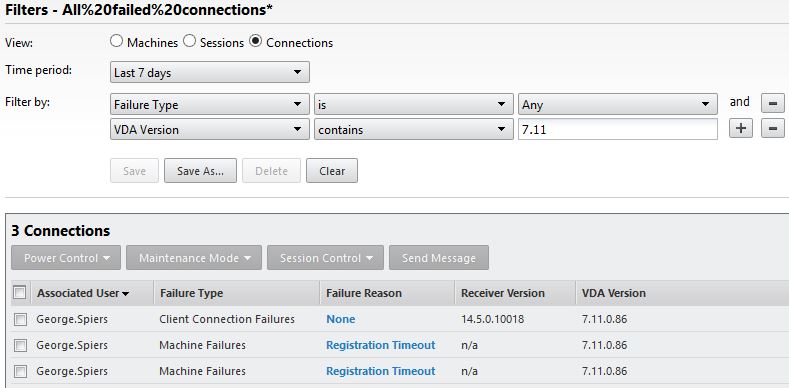
The Citrix Alerts Policy tab is new to Director 7.7+ and allows you to receive alerts including email alerts based on configured thresholds and rules. To create an alert click on Citrix Alerts Policy. You can create alerts for the Site, Delivery Groups, Servers or Users. Under Site Policy click Create.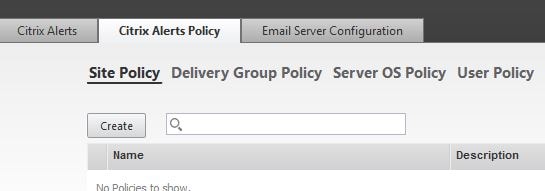
Enter a name and description. All the available conditions are displayed such as Average Logon Duration, Memory, CPU. For this example, I’ll create an alert that flags a warning when one user connection fails and an error/critical alert when two fails within 60 minutes.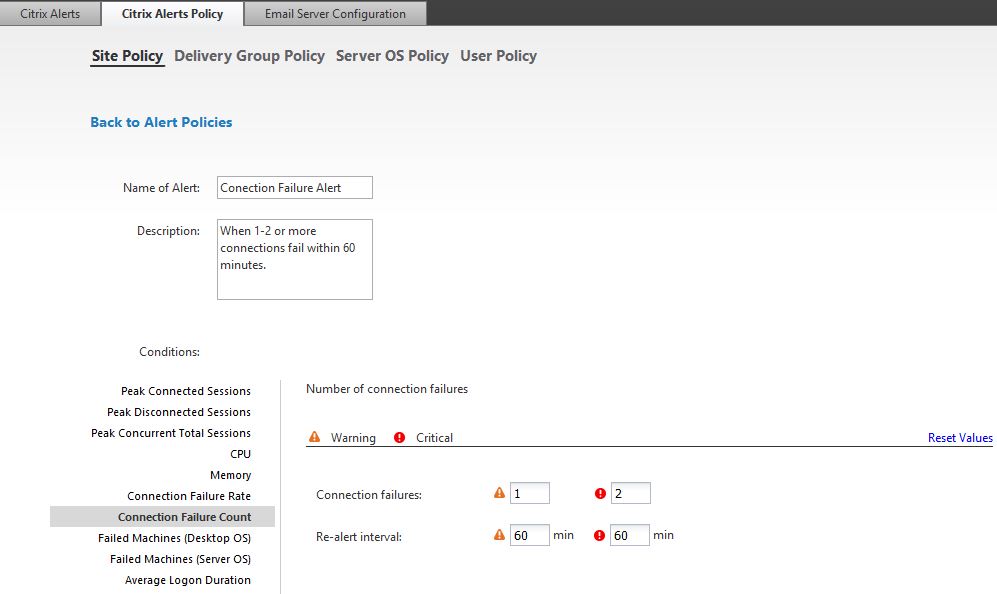
The alert shows as below and can be edited, disabled or deleted.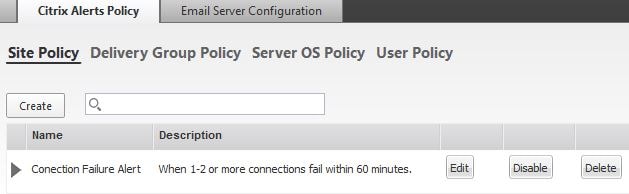
Now when 1 connection failure occurs, the warning alert flags within Director. You can configure email alerts for these conditions also. The alerts show both on the main Director Dashboard and within Alerts -> Citrix Alerts. Click on the start symbol.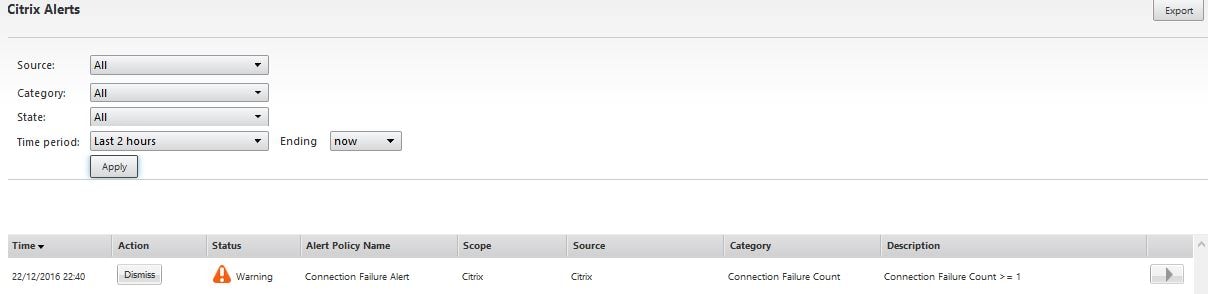
You can get a view of the history of this alert, this may help you identify any patterns or consistency in connection failures.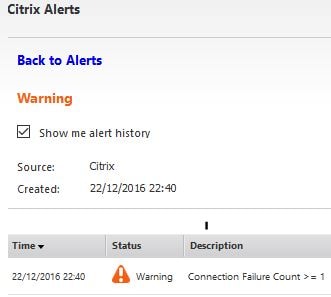
The Delivery Group alert policies contain some different conditions such as Load Evaluator Index. To assign this policy against a Delivery Group click the Assign button. Delivery Groups can contain desktop OS or server OS.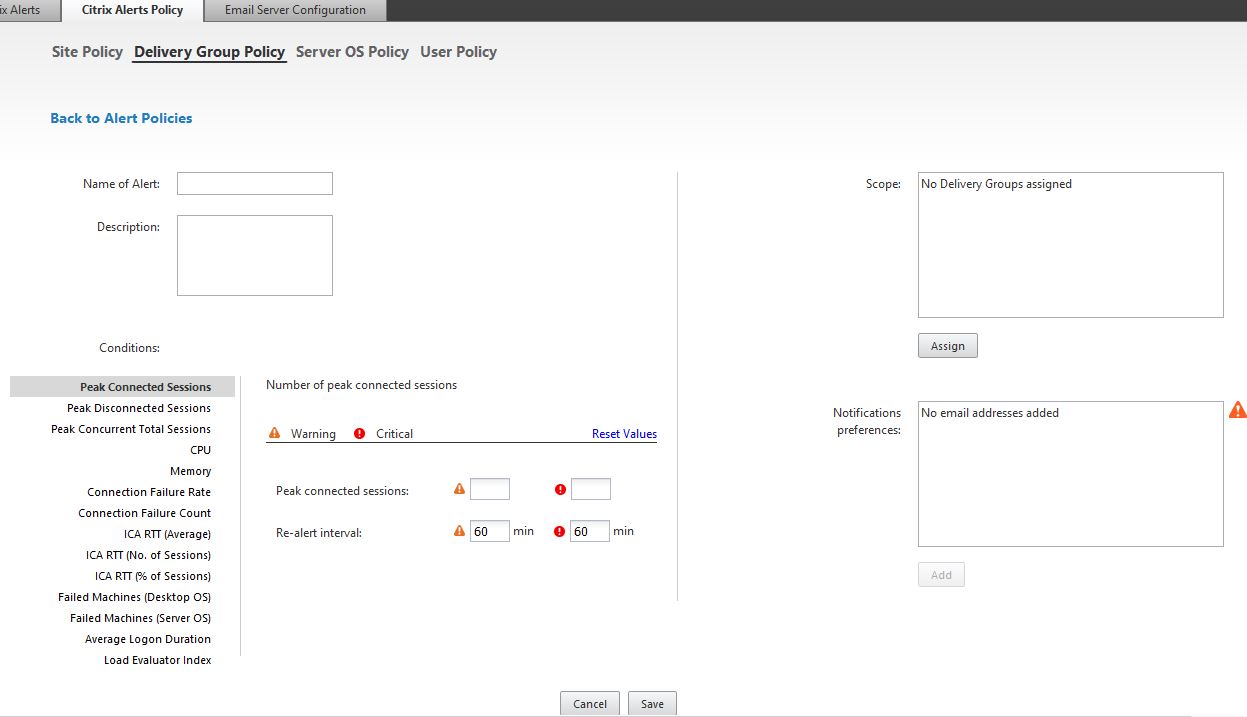
Select any number of Delivery Groups and click Done.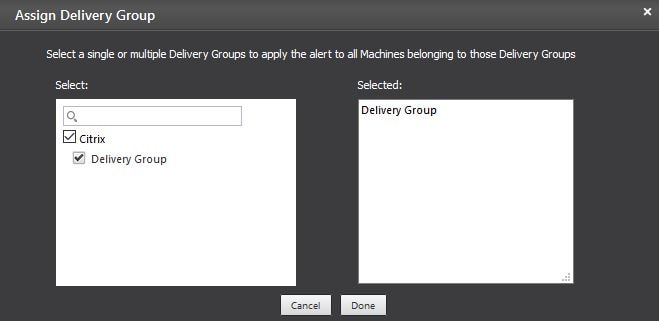
The Server OS Machine alert policies also are assigned by Delivery Group but only server OS machines get the alert rules.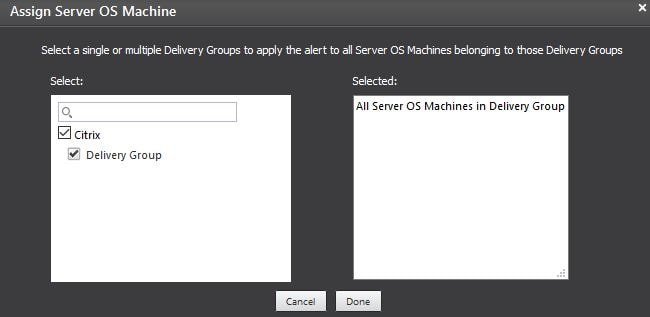
The User Policy alerts allow you to assign alerts against specific users. You use the search box below to search for and add users in Active Directory.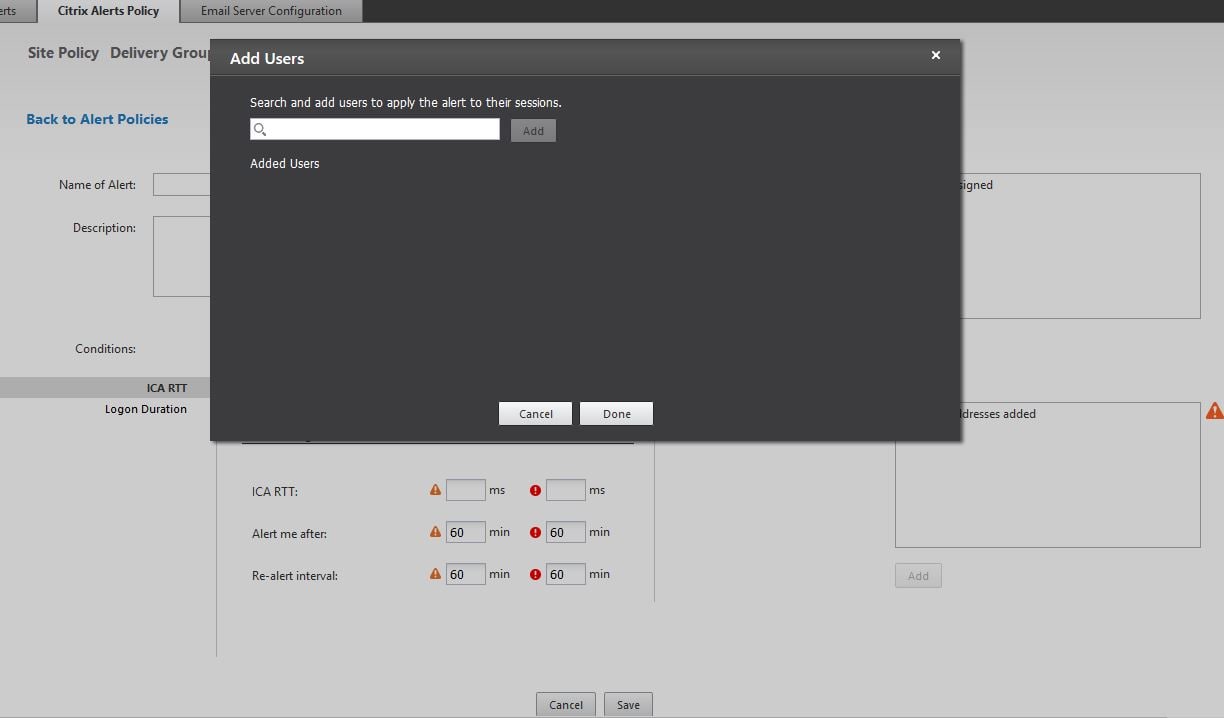
The Email Server Configuration tab is where you configure your SMTP server details so that you can be emailed when alerts are generated. Director supports SMTP, SMTP-SSL and SMTP-TLS.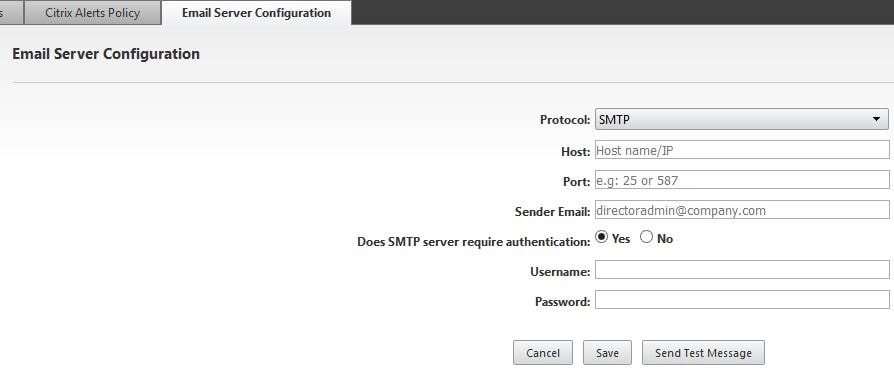
Integrate Director with NetScaler MAS
NetScaler MAS is used to collect HDX Insight from remote HDX WAN connections coming in through NetScaler Gateway. If you are a Citrix XenApp or XenDesktop Platinum license customer you can integrate this data in to Director to view all HDX Insight related data from the single Director console.
To configure and unconfigure NetScaler MAS with Citrix Director see https://jgspiers.com/citrix-netscaler-management-analytics-system/#Director-Integration
Note: MAS must be atleast version 11.1 build 49.16 and Director on version 7.11.
Director permissions
Permissions and access to Director is controlled through Citrix Studio. Generally, you will use the built-in roles within Studio such as the Help Desk Administrators role however you can create your own customised roles aswell. To create a custom role simply navigate to Citrix Studio -> Configuration -> Administrators -> Roles -> Create Roles. Now pick any action under the Director grouping. You can then configure administrators with this new role scoped against certain Delivery Groups or Machine Catalogs etc. This ensures they only have control over what their accounts are scoped against.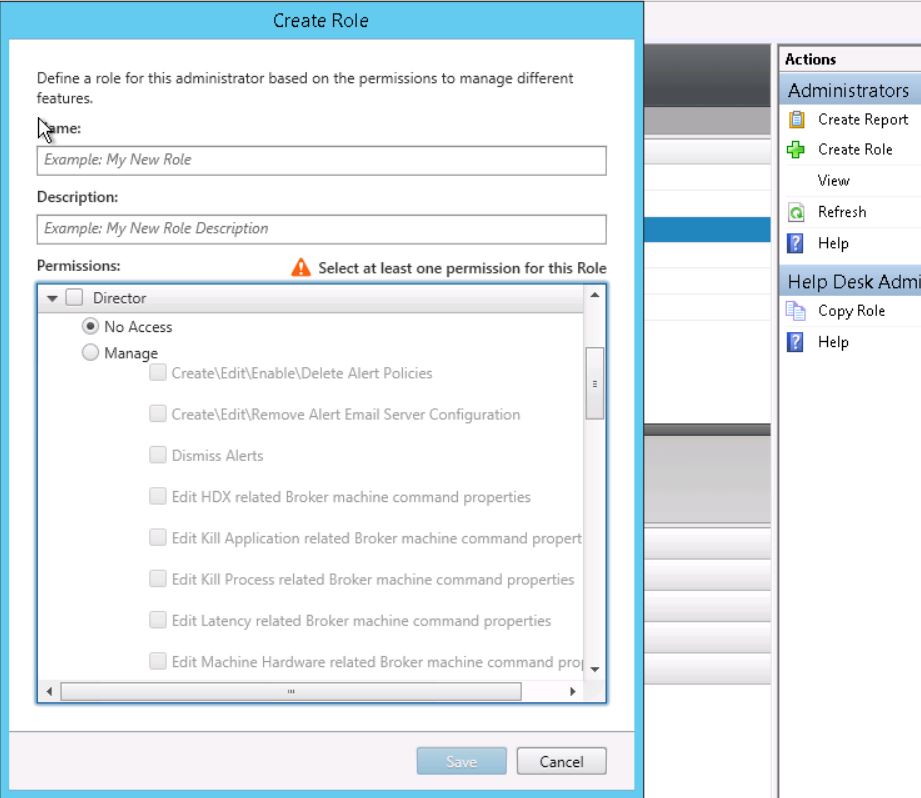 Note: You must grant custom role users the right to log on to Director and the right to view Delivery Group data. These permissions are found outside of the Director grouping. You can use other already made roles as a template, copying their permissions in to your new role and tweaking from there.
Director across forests
See https://docs.citrix.com/en-us/xenapp-and-xendesktop/7-12/director/advanced-configuration.html#par_richtext_2
Director multi-site monitoring
Director has the ability to monitor multiple XenApp and XenDesktop sites that are reachable. To add multiple sites perform the following:
- On the Director sever open IIS.
- Navigate to Default Web Site -> Director -> Application Settings.
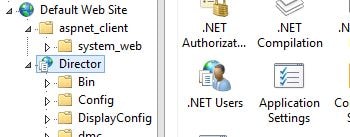
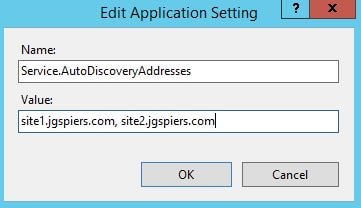
- Edit field Service.AutoDiscoveryAddresses and insert Delivery Controller FQDN’s from each site you want Director to monitor.
- Restart IIS using command iisreset /noforce
Note: You can also use the Director Config tool running a command such as DirectorConfig /ddc “site1.jgspiers.com, site2.jgspiers.com”
Director integration, monitoring and alerting with SCOM
See https://docs.citrix.com/en-us/xenapp-and-xendesktop/7-12/director/alerts-notifications.html#par_anchortitle_786e
Director data retention settings and granularity
By default 90 days worth of data is collected before being groomed from the database for customers who have a Platinum license. Use the Set-MonitorConfiguration to change these defaults.
Raw data i.e. session and connection information (non historical) that is live and current has it’s own grooming setting. Grooming makes sure that only the relevant data is kept historically to ensure performance standards are met and the database doesn’t grow out of control. This is because current data constantly grows and grows fast. Enterprise customer data is groomed after 31 days. Standard customer data is groomed after 7 days.
The granularity of data you see is based on the range of time you select. For example, if you view 2 hours worth of connection failures you receive data that has granularity of 2 minutes. 24 hours of data uses 2 hours worth of granularity. 7 days uses 2 hours, 1 month uses 1 day, 1 year uses 1 week.
Disable visibility of applications within Activity Manager
Any Citrix administrator who has access to the Activity Manager section in Director can see a list of running applications within a users session as shown below. Any member of the built-in Full Administrator, Help Desk Administrator and Delivery Group Administrator roles can access Activity Manager when using Director.To disable this ability edit (on VDAs) the TaskManagerDataDisplayed DWORD key from value 1 to value 0. This key is located in HKLM\Software\Citrix\Director\.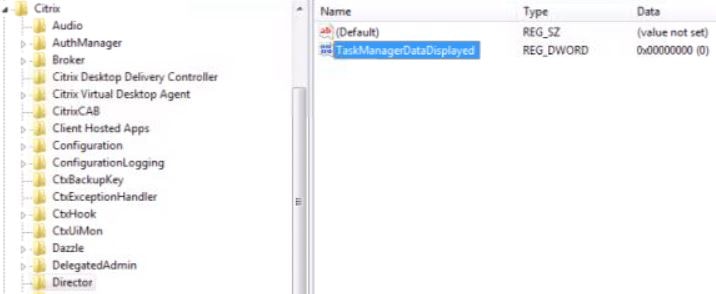
Within the Director server open IIS and navigate to Default Web Site -> Director -> Application Settings.
Modify entry UI.TaskManager.EnableApplications with a value of false.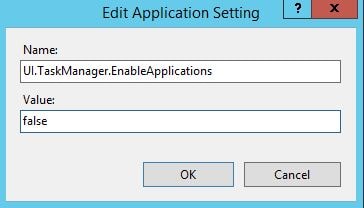
Session Idle times Director 7.13
The ability to view idle times for sessions has been released in Director 7.13. DDC and VDA levels must be 7.13. By viewing active sessions, an Idle Time (hh:mm) column is viewable.
Idle times are only available for Server OS VDA and the idle time only shows up/switches from n/a after 10 minutes of inactivity.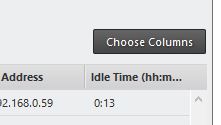
You can use filtering to filter sessions by idle time.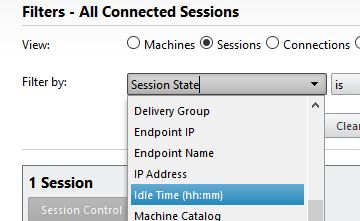
Application Failures (7.15) and Application Analytics (7.16)
In Director 7.15 a way to record and view application failures was released. By browsing to Trends -> Application Failures you can get a view of all application failures in the past hour and upwards. This includes the process that failed, a description of the failure and what machine the application failed on. With this information in Director, you may identify a bug or trend in how an application failured and pass that information to the developer.
Note: Your Delivery Controllers and VDAs must be running 7.15 or later. By default application failures on Server OS are recorded however you can edit Citrix policies to change that behaviour and/or enable application failure recording on Desktop OS VDAs.
Another feature which builds on Application Failures was released in Director 7.16 and names Application Analytics. This feature introduced a new tab alongside the Alerts section. As sown below, after clickinb on the Applications button a list of all published applications from your site appears. For each application, I can see how many instances of the application is running and how many faults or errors have occured on that application in the past hour. Click on the number below Instances for an application.
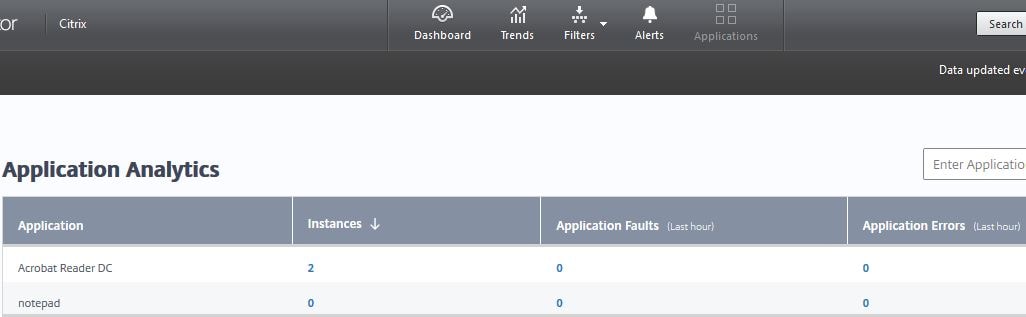
Your view will be filtered and you can see who exactly is running the application which in my case is Adobe Reader. Both active and disconnnected sessions will be displayed here and you can control the sessions as normal using Sessionn Control.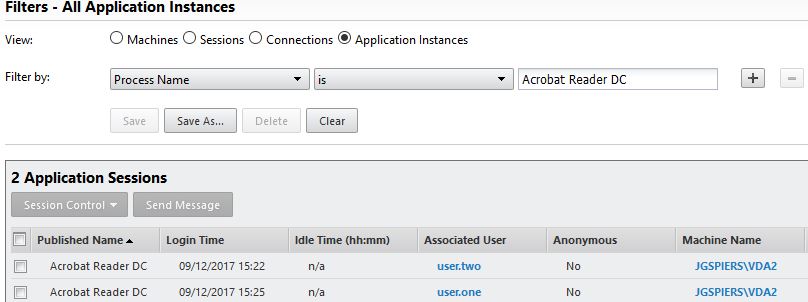
The filtered view is based on a new value called Process Name. 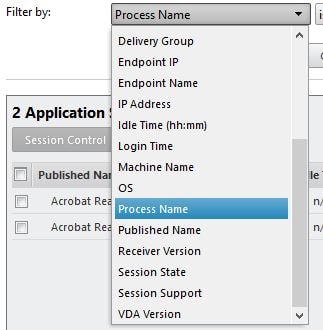
Note: Your VDAs must be running 7.15 or later and Delivery Controllers must be running atleast 7.16 to make use of Application Analytics.
Machine and user connnection failure reasons noted here https://docs.citrix.com/content/dam/docs/en-us/xenapp-xendesktop/7-12/downloads/Director-7.12-Failure-Reasons-Troubleshooting-Guide.pdf
Features by edition and version https://support.citrix.com/article/CTX216008
Pingback: Director 7.12 – Carl Stalhood
Pingback: Detailed Change Log – Carl Stalhood
Pingback: EUC Weekly Digest – December 31, 2016 – Carl Stalhood
King
January 4, 2017Do you know if there is there a way to limit how many backups of the user profile are stored in the profile store after a profile reset? Our service desk is profile reset happy. This would kill storage in the long term. A scheduled cleanup task is just messy solution.
George Spiers
January 4, 2017I don’t think there is a way. The user profile is renamed so a new one can be created and the contents copied across. If you limiting something like that then a reset would essentially not work. What’s wrong with a script that deletes folders with the .upm_ extension?
King
January 6, 2017In a large environment those folders can stack up. That is a lot of upkeep for profile store that has 10s of thousands profiles in it. It is just another upkeep script we have to maintain. Right now we have to run a cookie clean up script for IE cookies.
George Spiers
January 6, 2017Have you looked at Citrix Profile Management 5.5 or newer? – Citrix identified the most common cause of profile corruption to be due to corruption of the NTUSER.dat file. 5.5+ stores two copies and restores the good copy if the CPM engine detects corruption https://jgspiers.com/citrix-profile-management-overview/
Mtfrm18
January 13, 2017Do you have to upgrade your DDCs and VDAs in order to upgrade to Director 7.12? We have a 7.8 site currently but didn’t want to upgrade the DDCs and VDAs yet but not sure if that will limit the functionality or if it’s even supported. Thanks!
George Spiers
January 13, 2017You should be able to upgrade to 7.12 just fine provided it is installed on a separate server. In terms of support I’m not sure if there’s any official line about this however ideally I’d imagine Citrix would like you to use the same versions eventually and may ask that you upgrade the DDCs in the event you logged a support case.
Pingback: Director 7.13 – Carl Stalhood
Dennis Span
March 22, 2017Excellent write-up George! Must have taking you quite a bit of time 😉 Thanks!
George Spiers
March 22, 2017Thanks!
Pingback: Director 7.14 – Carl Stalhood
Pingback: Director 7.15 – Carl Stalhood
Pingback: Citrix Director – Digital Cloud Zone
Pingback: Citrix Director unattended installation with PowerShell - Dennis Span
Srini
November 8, 2017Do you know if we can configure email alerts when a server is Unregistered? Director only gives the option to configure alerts based on failed server OS machine based on the threshold. Let me know if there is any community script which can be useful to me
George Spiers
November 9, 2017Yes this might help you – http://www.davisphotoworks.com/blog/2013/1/restart-unregistered-xendesktop-vms-with-powershell
Pingback: Director 7.17 – Carl Stalhood
jagdesh
May 18, 2018Hi George,
I am unable to see logon performance for published desktops, while i am able to see logon performance for published applications for same user
Checked Citrix profile Mang Service is ruining on all server
Can you please help us on this issue
George Spiers
May 18, 2018What VDA version, what Director version? On the desktops are you seeing Event ID 1000 to indicate that a session is ready?
Pingback: Director 7.18 – Carl Stalhood
michael
August 28, 2018Excellent article, very usefull!
I would like to have special key users able to log in to the Director, but have several Tabs in Trends overview not visible for them. As I cannot find any filtering method in the Roles, is there something you know that I can do here?
Fx. only have the Sessions, Logon Performance, Machine Usage available in the Trends Page.
Cheers, Michael
George Spiers
August 29, 2018No there is no current way to do this.
Pingback: Director 1808 – Carl Stalhood
Pingback: Director 1811 – Carl Stalhood
Pingback: St. Louis PD Selects Citrix Enterprise Instead of Citrix Platinum
Pingback: Director 7.16 – Carl Stalhood
Pingback: Citrix XenApp & XenDesktop 7.x Migration FAQs | eG Innovations
Pingback: Citrix Director 1912 LTSR – Carl Stalhood
Serge
November 15, 2022Is there a way to disable the ability to send message in director ?
Pingback: Citrix Director unattended installation with PowerShell - Dennis Span