NetScaler Insight Center provides visibility towards Web traffic (Web Insight) and HDX traffic (HDX Insight) flowing through the NetScaler. It uses the already available AppFlow technology to fetch the data and as a result it is really simple to get up and running.
Note: NetScaler Insight Center is now End of Life. The successor to this platform is NetScaler MAS (Management and Analytics System). See https://jgspiers.com/citrix-netscaler-management-analytics-system/
NetScaler Insight Center is simply put, an AppFlow data collector.
- HDX Insight – Captures and analyses XenApp and XenDesktop traffic flowing through NetScalers. HDX Insight goes as far as dissecting the ICA/HDX protocol and informing you about what is actually going on at each virtual channel layer. This provides insight right down to the virtual channel layers.
What is a virtual channel?
Citrix say a large portion of functionality and communication between the Citrix Receiver client on your local device and the XenApp/XenDesktop servers take place over virtual channels. As new updates are released for XenApp/XenDesktop a new virtual channel may be released to provide for additional functionality. Virtual channels consist of COM ports, printers, graphics, audio, clipboard and more. The ICA protocol implements an internal QoS (Quality of Service) assigning different priorities to different virtual channel groups.
- 0 = Very High – Audio
- 1 = High – Clipboard
- 2 = Medium – Drive mapping
- 3 = Low – Print mapping
XenApp 6.5/XenDesktop 5.5 and above comes with a feature named ICA MultiStream which allows the ICA protocol to use different TCP connections for each of the four ICA channel groups (low, medium, high, very high). You can group each virtual channel in to the channel groups via RegEdit. MultiStream requires Session Reliability to be enabled on your farm. If you are using CloudBridge you do not need to enable ICA MultiStream as CloudBridge already optimizes the different ICA streams.
- Web Insight – Captures and analyses web traffic flowing through NetScalers.
NetScaler Insight Center is available to download from the Citrix website and comes as a Virtual Machine that runs on Hyper-V, ESX or XenServer platforms. The current version as of February 2016 is v11. The version of NetScaler Insight Center must be the same or a newer version than your NetScaler appliances.
HDX Insight reports are only displayed for NetScaler appliances running Enterprise or Platinum licenses. A Standard license provides data in real-time. If you have a XenApp/XenDesktop Platinum license you can integrate NetScaler Insight data with Citrix Director.
- Standard – Web Insight only with Standard license. HDX Insight not available.
- Enterprise – 1 hour of HDX data kept.
- Platinum – 1 month of data. NetScaler Insight v11+ allows for more than 1 month of HDX data.
Web Insight is available on all NetScaler license versions.
HDX Insight is not available on NetScaler Gateway/Access Gateway licenses.
Up to a maximum of 4 AppFlow collectors can be enabled on a NetScaler appliance.
For firewall port requirements see http://docs.citrix.com/en-us/netscaler-insight/11-0/before-you-begin.html.
NetScaler Insight Center and the NetScaler appliance communicate over the NSIP of the NetScaler.
NetScaler Insight Center generates reports for applications and desktops that are published through XenApp/XenDesktop and accessed through Citrix Receiver depending on what operating system and Receiver client is installed on and the Receiver/browser version. NetScaler does not parse ICA traffic from Receiver clients running on thin clients, iOS or Android OS.
For supported OS, Receiver and browsers see http://docs.citrix.com/en-us/netscaler-insight/11-0/before-you-begin.html#par_richtext_0.
NetScaler Insight Center monitors NetScaler ADCs when the NetScaler ADC appliance is deployed in transparent mode. Transparent mode is where clients can access the XenApp/XenDesktop servers directly without being proxied through a NetScaler Gateway.
NetScaler Insight Center can monitor NetScaler Gateway appliances when they are deployed in single-hop mode, that is, the NetScaler sits on the edge of the network and proxies ICA connections over 443 to XenApp/XenDesktop. This is the simplest and most common deployment.
External users who access XenApp and XenDesktop authenticate themselves through the NetScaler Gateway. Internal users however do not need to travel through the Gateway obviously. If you set the NetScaler up in Transparent Mode so users don’t have to touch the NetScaler Gateway you need to make sure the correct routing policies are in place. Instead of doing this, you can deploy a Cache Redirection vServer which acts as a SOCKS proxy and LAN users can avoid having to go through the NetScaler Gateway. This method also ensures the ICA traffic still flows through the NetScaler ADC. Ths is called LAN User Mode and is a new feature in NetScaler 11. To set this up, you need to create a Cache Redirection vServer with protocol set to HDX, bind the AppFlow NSIC policy globally on the NetScaler and made modifications to the launch.ica file so that new connections will proxy through the Cache Redirection vServer.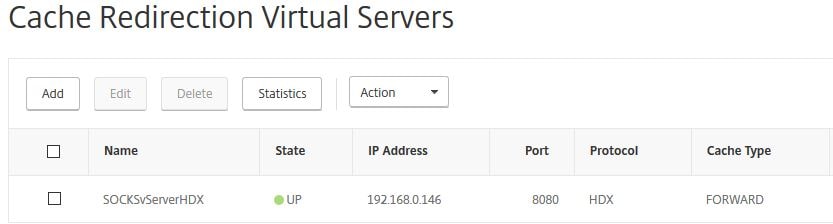
As a summary, when you have NetScaler Insight Center deployed in your network, you will be able to:
- Get a view of users round trip (ICA RTT/screen lag) time. This is the time taken from a user clicking or moving the mouse cursor to seeing that action complete visually.
- View WAN latency, DC latency, bandwidth being used by groups or individual users, top users by consumption, top number of applications or desktops launched etc.
- View bandwidth being consumed by applications and application session counts, DC latency, WAN latency to the application
- View bandwidth being consumed by desktops and desktop session counts, DC latency, WAN latency to the desktop
- View the traffic hitting each instance of NetScaler
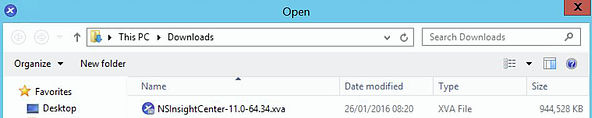
Depending on the Hypervisor you use, log on to the Citrix website and download NetScaler Insight Center. I am running XenServer so the media I am downloading at this time is named NetScaler Insight Center for Xen 11.0 Build 64.34.
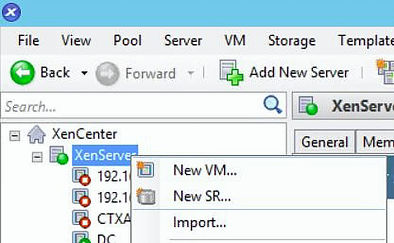
Right-click your XenServer -> Import.
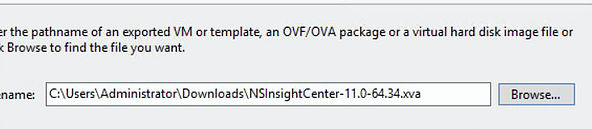
Click Browse to locate the Insight Center media.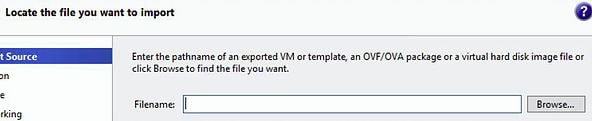
Select the XenServer you want to host the VM. Click Next.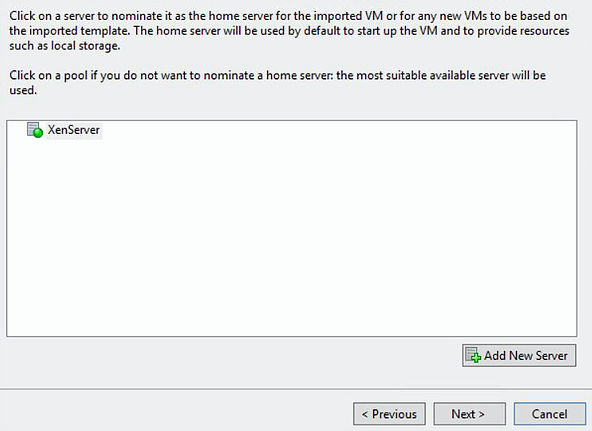
Select an appropriate storage repository to store the VM. Click Import.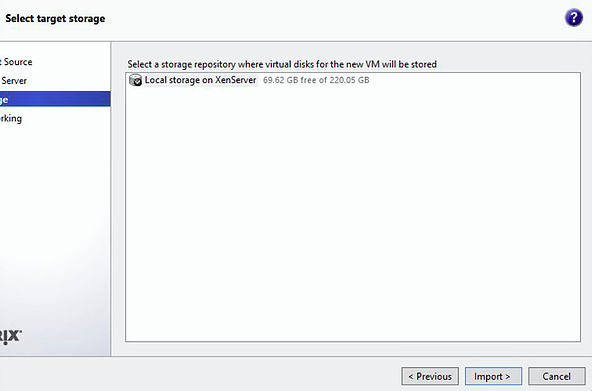
Select a NIC to attach to the VM and click Next.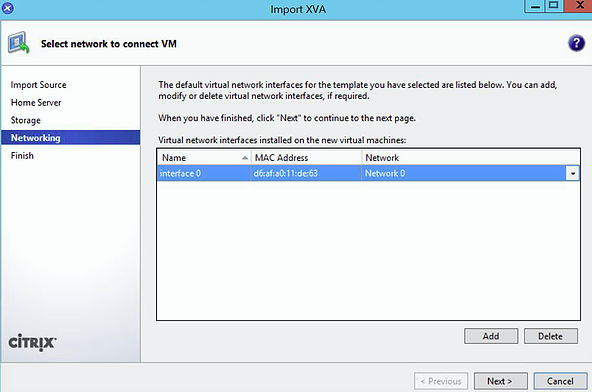
Click Finish to begin the VM creation.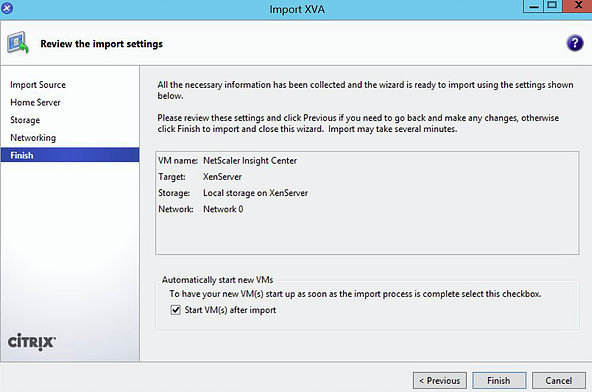
Once the VM has been provisioned power it on and perform some initial configuration via the CLI. Specify an IP address for your NetScaler Insight Center VM, network mask, gateway and DNS IP. Select option 6 to save and quit.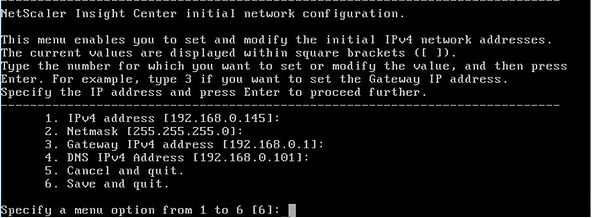
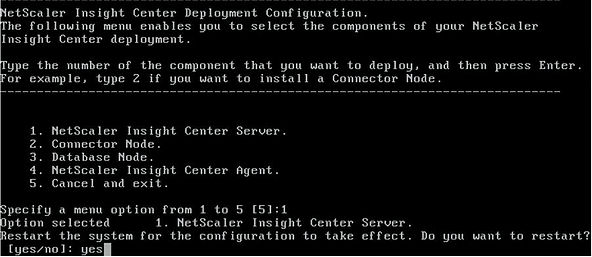
Since this is the first NetScaler Insight Center server being provisioned, select option 1 and press enter.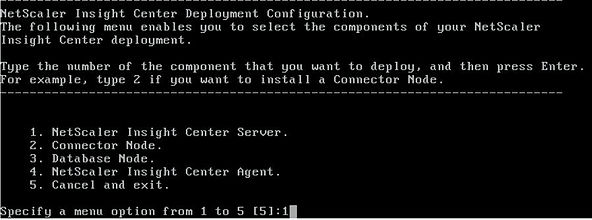
Type Yes and press enter to restart the VM.
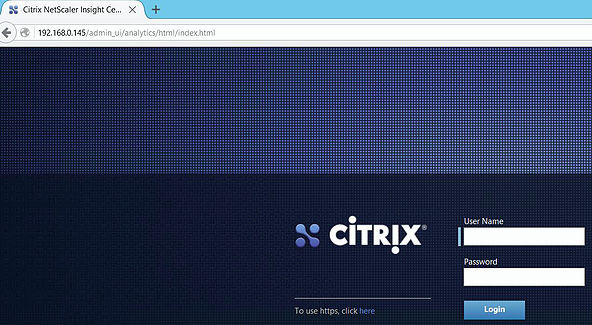
At this stage after restart you can log on to NetScaler Insight Center via a web console using the IP address you configured for the VM earlier. The management GUI runs over HTTP but can be changed to run over HTTPS. I’ll show you how to change this later.
- Default username – nsroot
- Default password – nsroot
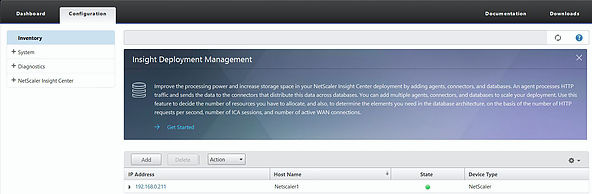
Click on Get Started.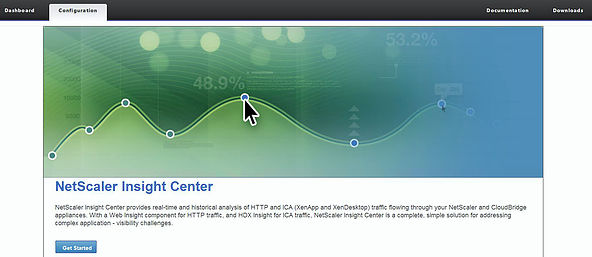
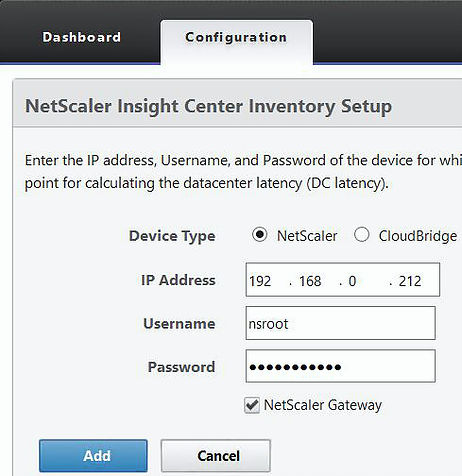
Enter the IP address of the NetScaler appliance you want to monitor. Use credentials of the nsroot account. If the device is a NetScaler Gateway, check the box.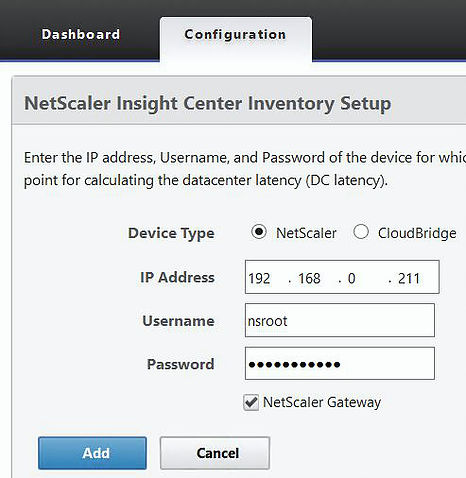
After the NetScaler has been added the list of vServers running on the appliance is displayed.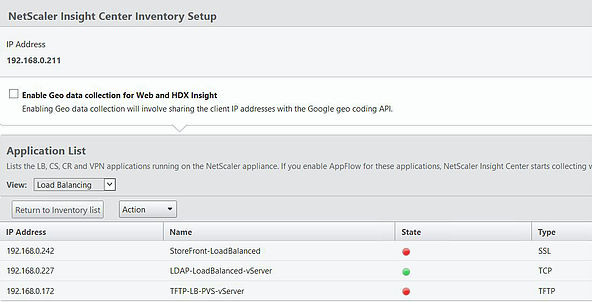
Click on the View drop-down box and select VPN.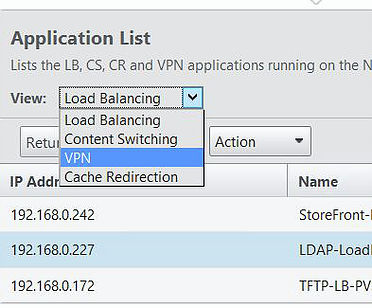
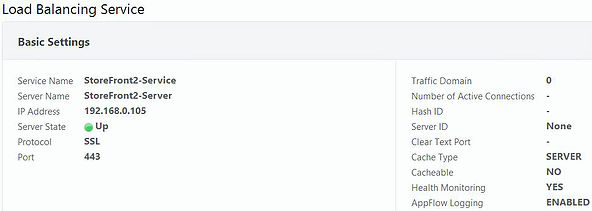
Select the NetScaler Gateway vServer that runs on your NetScaler appliance, select Action -> Enable AppFlow. Obviously you can enable AppFlow for Load Balanced vServers, Content Switching vServers and Cache Redirection vServers as the drop-down above suggests.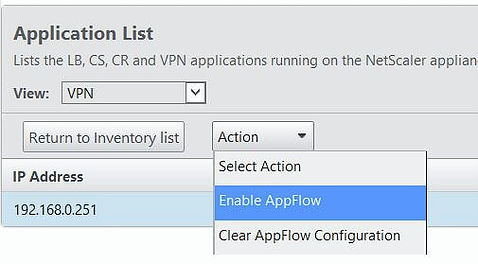
Once you select Enable AppFlow the following screen appears. Select true under Select Expression and ICA under Export Option and click OK. Make sure port 22/SSH is open between NetScaler Insight Center and NetScaler or AppFlow configuration will fail.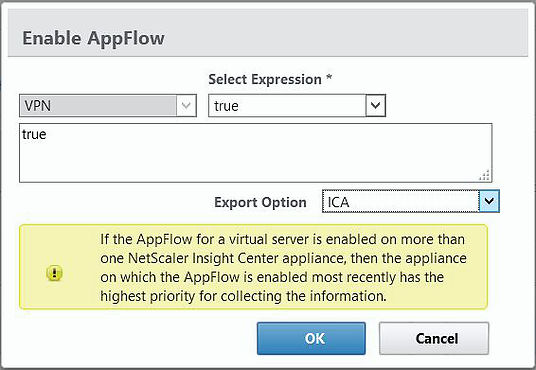
My NetScaler Gateway vServer is now monitored by Insight.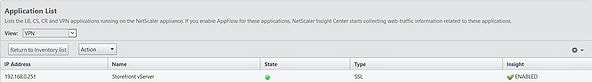
To add more NetScaler appliances click on Configuration -> Inventory -> Add.
 Enter the appropriate details and click Add.
Enable AppFlow against your vServers.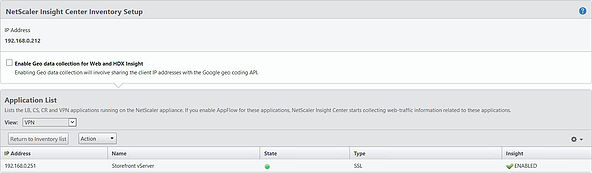
Note: If you have a highly available NetScaler pair, add each node individually.
There are many configurational operations you can perform on NetScaler Insight Center. Click Configuration -> System -> Change Time Zone.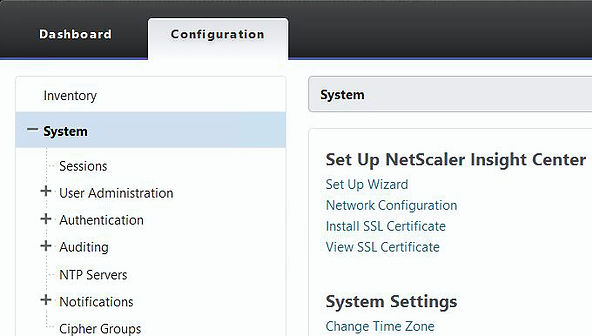
Select your regions time zone and click OK.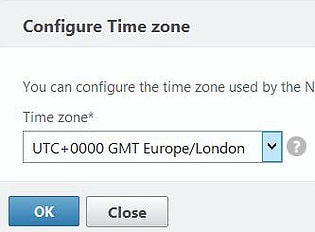
Configure a hostname for the Insight server appliance.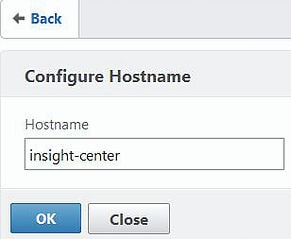
To add new NetScaler Insight Center users navigate to the below section and click Add.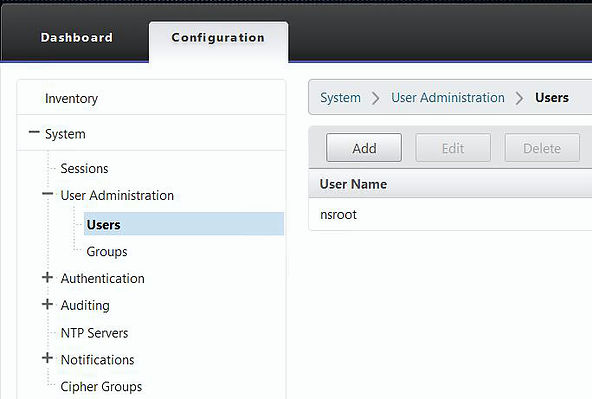
Enter a user name, password and group such as owner for full access or read_only and click Create.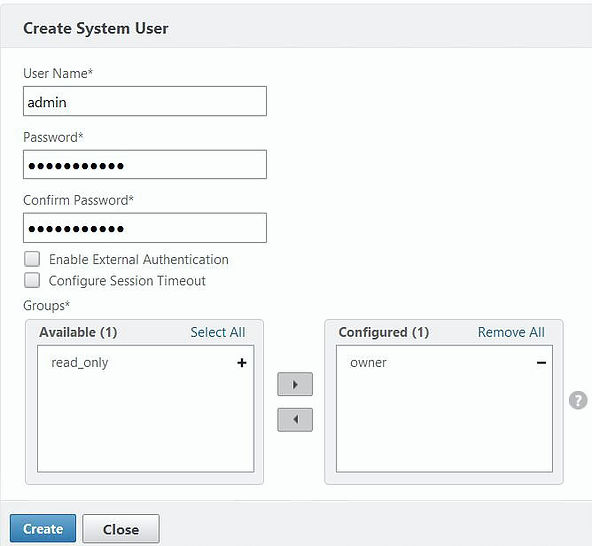
You can add LDAP servers to provide external authentication. Navigate to System -> Authentication -> LDAP -> Add.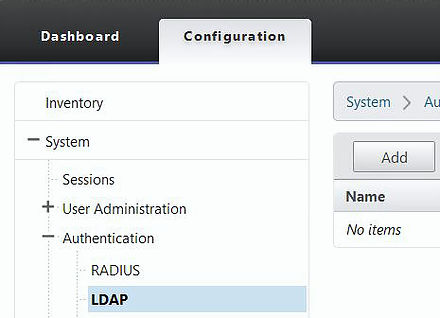
Enter your LDAP server details as below. Click OK.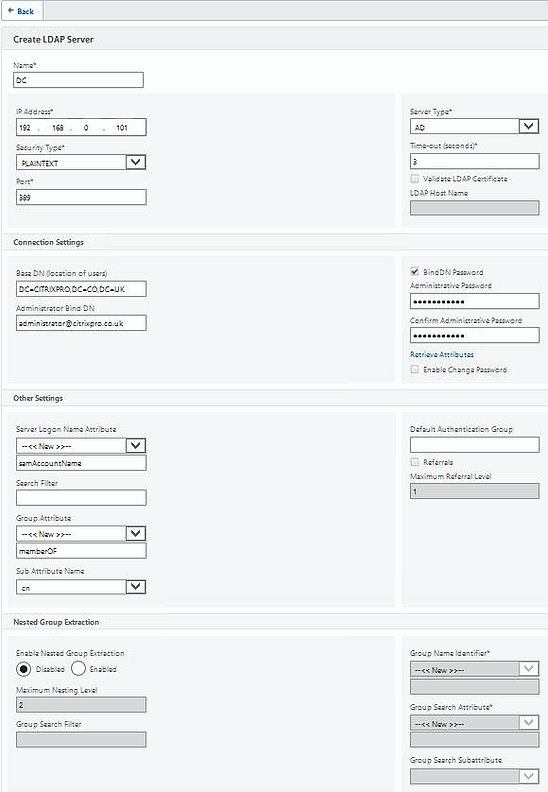
Navigate to System -> Authentication -> Authentication Configuration.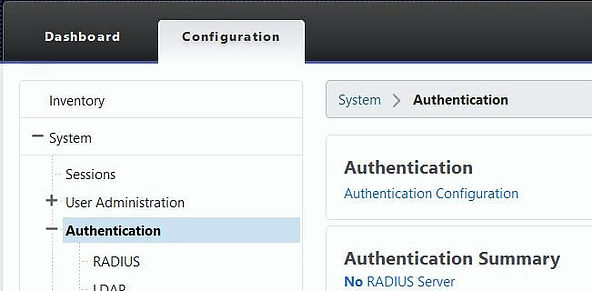
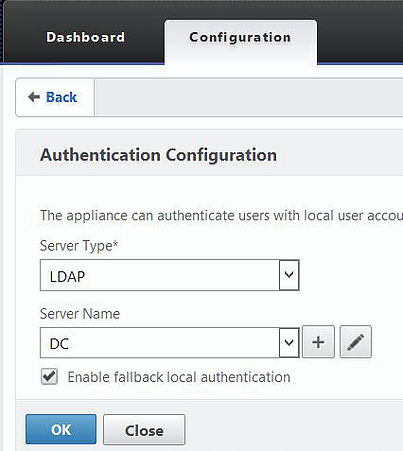
Select LDAP under Server Type and then choose your LDAP server under Server Name. You can also keep the local authentication method as a fallback. Click OK.
Now as an example, you can create a group which matches one in Active Directory. You can give that group permissions such as admin and all users who authenticate to Insight Center and are members of that group will get administrative permissions. Navigate to System -> Users Administration -> Groups -> Add.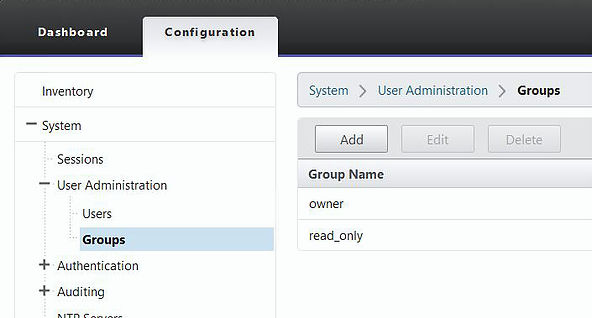
Type a group name that reflects an existing one in Active Directory i.e. Domain Admins. Specify the admin permission and click Create.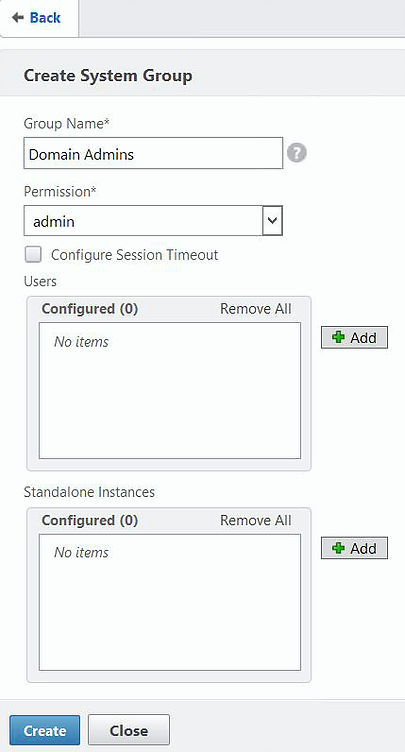
Now log on as a Domain Admin. You will have been successfully authenticated by LDAP and given admin permissions on Insight Center.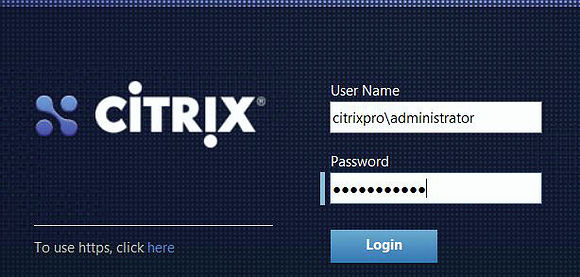
Navigate to System -> User Administration -> User Lockout Configuration.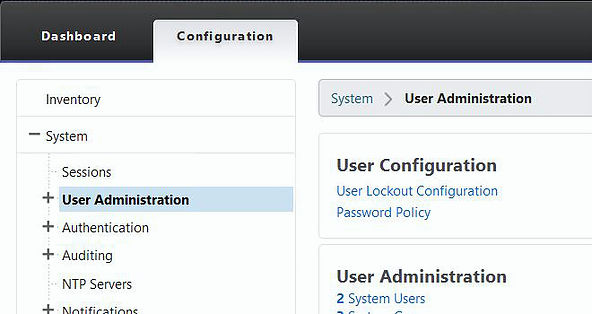
Specify lockout values if required. The default is 3 login attempts before an account is locked out for 30 seconds.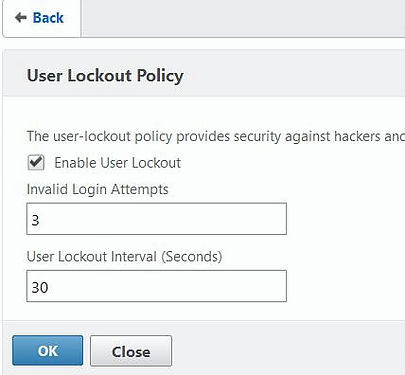
Navigate to System -> User Administration -> Password Policy.
Enable password complexity and specify a minimum password length value.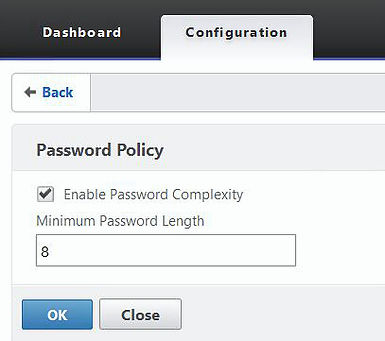
Now when you try to create a user account below the password complexity requirements you will get an error message.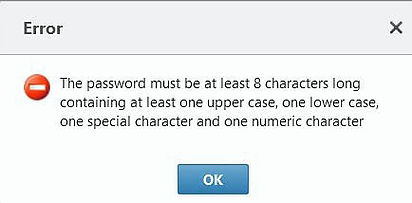
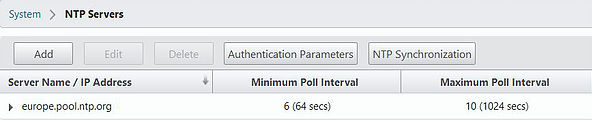
Navigate to System -> Auditing -> NTP Servers -> Add.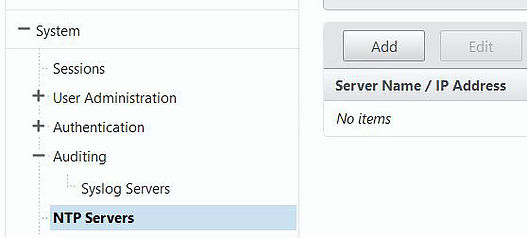
Enter an NTP server name/IP address and click Create.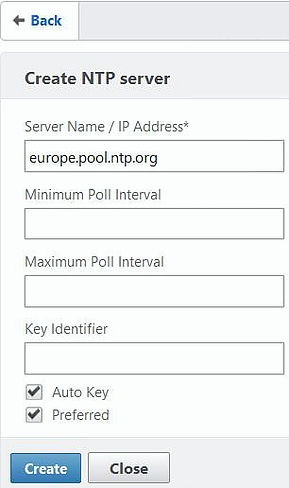
Click NTP Synchronization.
Tick Enable NTP Synchronization -> OK. 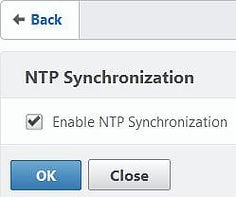
Navigate to System -> Network Configuration.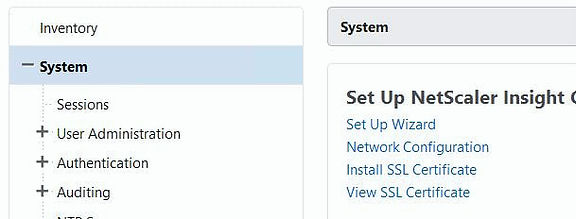
Here you can change the Insight Center servers network settings.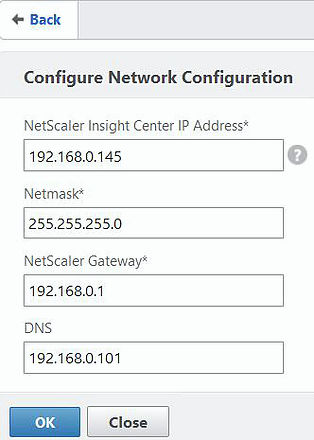
Navigate to System -> Install SSL Certificate.
Generate and import a certificate you have generated for the NetScaler Insight Center. I enrolled for a certificate with the subject of insight.citrixpro.co.uk through my Active Directory Certificate Authority.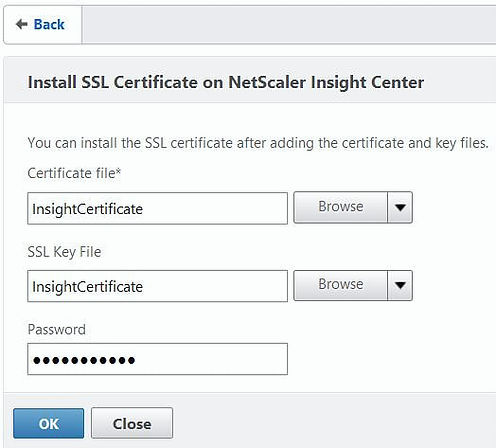
Click Yes and restart the appliance.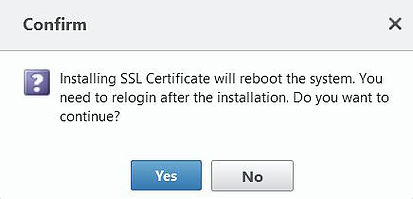
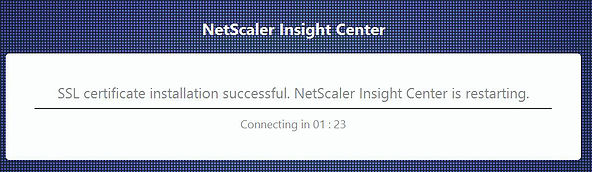
Once Insight Center has restarted, log back in and navigate to System -> Change System Settings.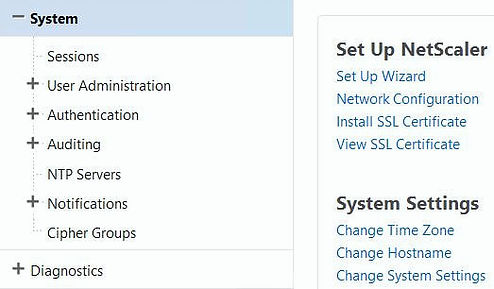
Tick Secure access only and click OK. This only allows HTTPS access to NetScaler Insight Center. If you leave this box unticked then you can access Insight Center via HTTP or HTTPS. If this box is left ticked all HTTP requests will be redirected to HTTPS automatically.
Note: If using Director to integrate HDX Insight from Insight Center, using Secure Access Only means Director can only speak to Insight Center also using HTTPS. Make sure that certificate’s are correct for communication to work.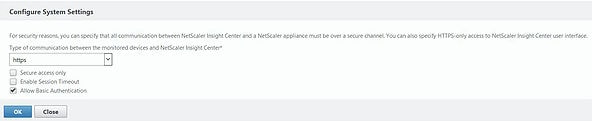
You can now access the NetScaler Insight Center management GUI via HTTPS.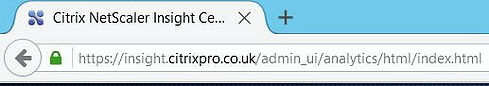
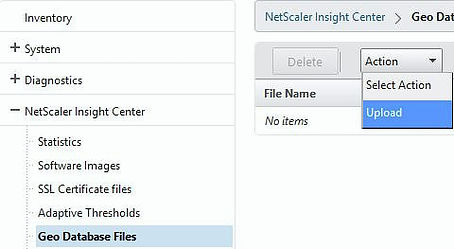
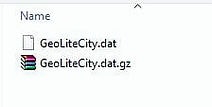
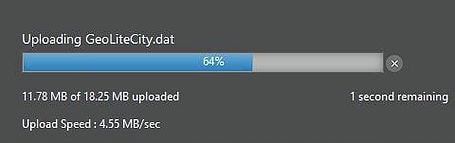
Download GeoLite City from http://geolite.maxmind.com/download/geoip/database/GeoLiteCity.dat.gz and extract the file then upload to Insight Center.
Navigate to Inventory and click on one of your NetScaler appliances.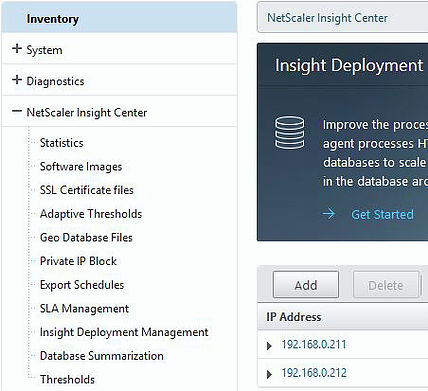
Enable Geo data collection via the tick box. Repeat process for any remaining NetScaler appliances.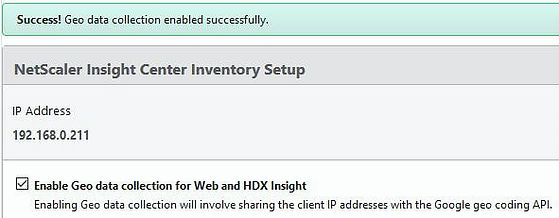
Navigate to NetScaler Insight Center -> Private IP Block -> Add.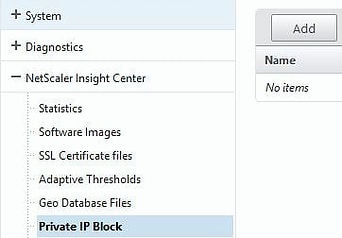
Create an IP block based on a geographical location.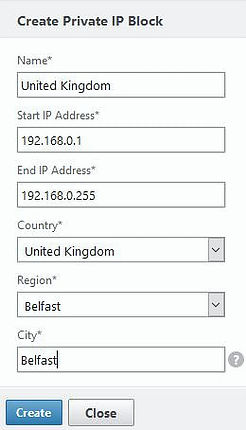
Now as users connect through the NetScaler Gateway we can see where on the map that user came from.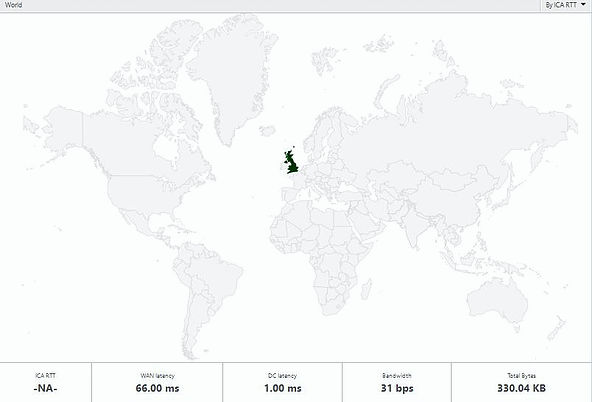
The below shows some statistics of an ICA session being proxied through NetScaler Gateway. Showing the ICA RTT (screen lag time), WAN latency, DC latency and bandwidth.![]()
Some of the Virtual Channels and their bandwidth consumption is shown.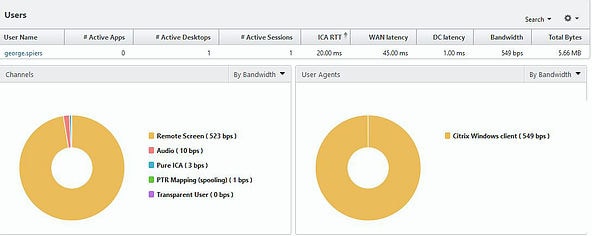
Note that you may be required to enable AppFlow logging on NetScaler Load Balanced Services or NetScaler Gateway vServers before any data is captured.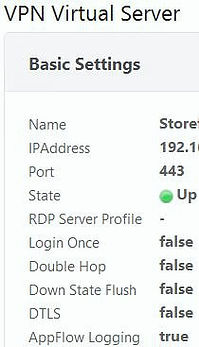
Resetting the NSIC appliance nsroot password
Restart NSIC and once you see Loading /boot/defaults/loader.conf continuously press the number 6 on your keyboard.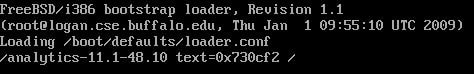
You should reach a Welcome to FreeBSD! screen. Type boot -s and press enter to boot in to safe mode. 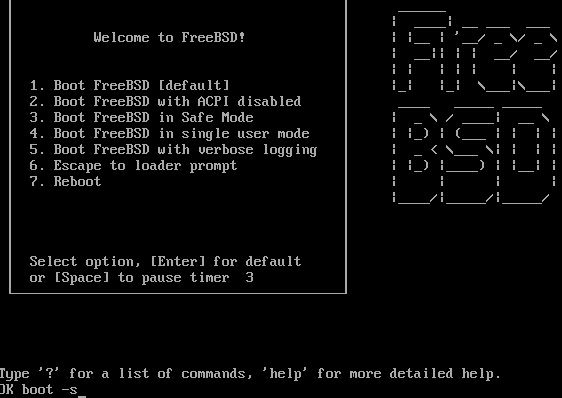
Now enter the following commands (Hyper-V/XenServer, see notes below screenshot for the mount command for vSphere):
- mount /dev/ad0s1a /flash (if you gget can’t exec mount error run the command again)
- touch /flash/mpsconfig/.recover
- reboot
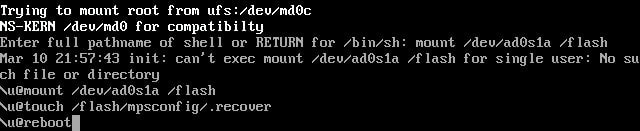
Now Insight Center will be using the default nsroot credentials.
Note: vSphere mount command – mount /dev/da0s1a /flash
Troubleshooting
NetScaler Insight Center troubleshooting tips http://docs.citrix.com/en-us/netscaler-insight/11-0/ni-troubleshoot-tips-ref.html
Also read the HDX Insight Diagnostics and Troubleshooting Guide – https://support.citrix.com/article/CTX215130
Web Insight data will not appear on Insight Center if using NetScaler builds earlier that 11.0.66.11 and using Integrated Caching. The issue was fixed in build 11.0.66.11.
When you have enabled AppFlow against your NetScaler Gateway or Load Balanced vServer etc. and you can not see any Insight traffic, make sure firewall rules are in place to allow UDP 4739 from NetScaler to NSIC. You can check if NSIC is receiving any appflow traffic by performing the following steps:
Launch PuTTY, and connect to your NetScaler Insight Center IP.
Type shell. Press enter.
Type command tcpdump -i 1 src NSIP and dst port 4739 where NSIP = your NetScaler IP.![]()
If you still do not see NetScaler AppFlow data, connect to your NetScaler appliance with PuTTy.
Run command disable feature appflow followed by enable feature appflow.
Review the NSIC putty screen to see if traffic is appearing. If not, review firewall configuration.
Example output showing AppFlow traffic between NetScaler Insight Center and NetScaler VPX.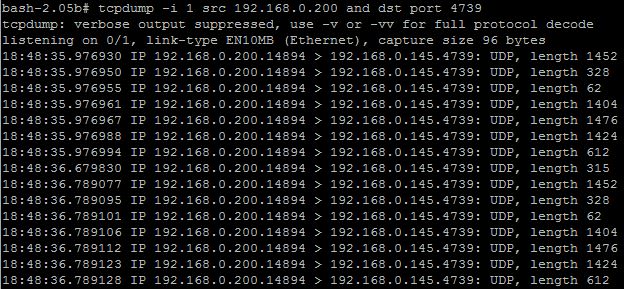
Rob
August 23, 2016I am working with a customer who does not want to use netscaler gateway. The make a direct Lan user connection to storefront. So I thought the Socks proxy option (LAN User) would work, only I am having problems setting this up. It doesn’t seem to be documented anywhere. I find it obnoxious that citrix assume that everyone who wants to monitor applications inside citrix sessions has a VPN solution. Edgesight was a perfectly good one box solution that could drill into a citrix session host, without the need 2 or 3 netscaler appliances and certainly no dependency on a VPN gateway.
I have setup appflow on a cacheredirection HDX vserver / Storefront vserver, dns vserver, running on x1 Netscaler ADC with an additional 2 netscaler insight appliances. I have added the netscaler to the inventory and I am seeing appflow data for incoming storefront connections (I have also changed the DEFAULT.ICA file to point to the SOCKS PROXY). However I am not seeing appflow for the citrix sessions at all.#
Any help appreciated?
George Spiers
August 23, 2016Hi Rob,
You mention users make a direct LAN connection to StoreFront. Citrix Director can monitor HDX traffic for LAN users connecting direct to StoreFront. You also get application level insight if you are a XenApp/XenDesktop Platinum customer. You would only use NSIC if you want internal HDX LAN traffic to route through the NetScaler. Is this what you want?