An overview of Citrix Smart Tools, one of the Citrix Cloud services previously known as Citrix Lifecycle Management. This services allows you to automatically provision, manage and monitor Citrix workloads running on private and public clouds.
♣ Citrix Cloud Status Portal
♣ Citrix Smart Tools Portal
♣ Licenses
♣ Smart Tools Agents
♣ What information does Smart Tools have on your site?
♣ Add users (administrators) to Smart Tools
♣ Create a Resource Location (Hyper-V) and install the Smart Tools Connector Agent (example)
♣ Enrol site to Smart Tools when installing Delivery Controller (7.14+)
♣ Citrix Smart Build (deprecated)
- ♣ Smart Build: (deprecated) Automated deployment of Citrix XenDesktop farm (example)
- ♣ Create a template machine for Blueprint deployment
- ♣ Pausing or retrying failed Blueprint deployment steps
- ♣ Troubleshooting a failed Blueprint Deployment
- ♣ How to delete a Deployment Profile:
- ♣ How does Smart Check work?
- ♣ What data does Smart Check collect?
- ♣ Smart Check System Requirements
- ♣ What checks does Smart Check perform?
- ♣ Additional custom health checks (VDA Health Check)
- ♣ Add Site to Smart Check
- ♣ Smart Check Schedules
- ♣ Upload Site Diagnostics to CIS via Smart Check
- ♣ Install Smart Tools Site Agent on Multiple Delivery Controllers
- ♣ Remove Site from Smart Check
- ♣ Smart Check Log Files
♣ Citrix Smart Migrate (deprecated)
- ♣ Smart Scale Requirements
- ♣ Add Site to Smart Scale
- ♣ Create Smart Scale schedules and load scaling
- ♣ Enable/Disable Smart Scale error event notifications
- ♣ Remove Site from Smart Scale
- ♣ Troubleshoot Smart Scale
Smart Tools consists of the following features to date (July 2017):
- Smart Build (deprecated) – Allows you to automate Citrix deployments on-premise or in the cloud using blueprints that are created by you or by way of pre-built templates.
- Templates exist for XenApp, XenDesktop, Secure Browser, NetScaler, Active Directory and XenMobile.
- Everyone gets rights to deploy pre-configured blueprints to their resource location.
- Smart Migrate (deprecated) – Assists with the migration from XenApp 6.x to XenApp or XenDesktop 7.x. Includes assistance for migrating applications, desktops and policies.
- Smart Check – Provides health monitoring for your Citrix envrionment.
- You get notifications about recommended fixes and issues found in your environment during regular health checks and health check reports.
- Manage updates to your environment including which updates are pushed out and when.
- Smart Scale – Usage and schedule based scaling on-premise or in the cloud helps to ensure that machines especially in the Cloud are only running when they are needed to avoid charges. You control resource availability and capacity during peak and off-peak times.
- Smart Scale can run on Azure and AWS, or on-premise.
Note: For a list of what’s new to the Citrix Smart Tools suite, see https://manage-docs.citrix.com/hc/en-us/articles/212715303-What-s-new
The Citrix Cloud Status Portal
The status of all Citrix Cloud services and in our interest Smart Tools can be found at http://status.cloud.com/ – This is a live page that updates in real-time.
You have the option of subscribing to all alerts or specific ones by email, SMS, slack, or by other webhooks.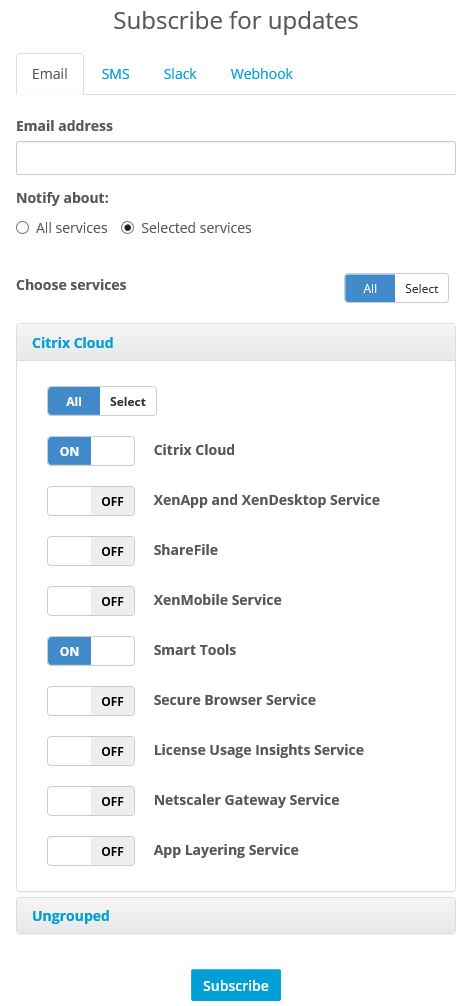
The Citrix Smart Tools Portal:
You’ll see a number of tabs when logged on to the portal:
- Resources & Settings – Shows existing and allows you to add additional Resource Locations. Allows you to edit administrator roles.
- Blueprint Catalog (Now renamed Checks and Blueprints) – A catalog of Blueprints and checks which you can search for and add to your library.
- Smart Build (deprecated) – From here you kick off the deployment of Blueprints. You can also create new Blueprints, edit existing ones, create scripts, share or clone Blueprints, add your your own custom alerts to the Smart Check Alerts Database. This is where your Library is located. If you are a member of multiple Citrix Smart Tools accounts, you’ll have a library for each account.
- Manage – This tab allows you to manage deployments and servers that have been provisioned to your Resource Location during Blueprint deployment. You can also scale deployments or tear them down.
- Smart Migrate (deprecated) – Provides assistance in migrating application and policy settings from XenApp 6.x or VDI in a box 5.4 (now removed) to XenApp or XenDesktop 7.x.
- Smart Check – From here you can view existing sites, or add new Citrix sites. You can upload site diagnostic data to Citrix Insight Services, perform health checks for example site checks or apps and desktops health checks, perform update checks, perform LTSR checks (Preview) and and view health reports.
- Smart Scale – Enable scaling. Define if you want to scale based on schedule, based on load or both. You can specify to scale based on the Load Index of VDAs or based on session count. Create schedules and more.
Licenses:
The Smart Tools features (Smart Build (deprecated), Migrate (deprecated), Check, Scale) are available for:
- XenApp and XenDesktop service customers are entitled to all tools.
- Citrix Workspace service customers are entitled to all tools.
- XenApp/XenDesktop customers with Customer Success Services – Select (previously Software Maintenance) are entitled however only Platinum customers are entitled to Smart Scale.
- XenMobile customers with Customer Success Services – Select (previously Software Maintenance) are entitled to everything but Smart Build (deprecated).
- NetScaler customers with Customer Success Services – Select (previously Software Maintenance) are entitled to everything but Smart Build (deprecated).
- Citrix partners are entitled to the tools.
Smart Tools Agents:
There are a couple of different agent types available. Agents can be installed automatically during Blueprint deplyoment or manually on machines that already exist in your Resource Location that you now want Smart Tools to manage. You can also install the agent manually at the end of a 7.14+ Delivery Controller installation (more on that later).
- Smart Tools Agent – Can be installed manually or automatically when Blueprints provision machines. If installed manually, you add the machine to Smart Tools afterwards. The agent is there to perform configuration tasks such as installing SQL, installing XenDesktop, creating a Citrix Site, perfoming scaling activies, data gathering and so on.
- Smart Tools Connector Agent (Connector) – When you create a Resource Location, you manually install a Smart Tools Agent on machines in your Resource Location and then promote those machines to Connectors. Machines that are designated as a Connector will broker communication from Citrix Cloud/Smart Tools to your Resource Location. If you have multiple Resource Locations for example XenServer and vSphere, a Connector on XenServer can act as the Connector for the vSphere environment also providing the connector can communicate with machines from both Resource Locations. If you have a Resource Location that is accessible from the Internet, you don’t need a Connector.
- Smart Tools Site Agent – This type of Connector is installed on one or more (for high availability) Delivery Controllers in your site. One agent will always be active on a Controller in a Citrix Site and others will be passive. The Site Agent allows Citrix Smart Tools to monitor the Citrix Site performing health checks, searching for applicable updates and scaling the environment.
The Smart Tools Agent can be installed on Windows 7 through to Windows 10 desktop OS (excluding Windows 8.1) or Windows Server 2008 through to Windows Server 2016 server OS. It can also be installed on a mixture of Linux OS.
When a Blueprint installs Smart Tools Agent, port 22 (SSH) should be open on Linux devices and TCP port 3389 (RDP) on Windows devices. These ports must be open to facilitate agent deployment but can be closed once the blueprint deployment is complete. HTTPS port 443 is used for communication to Citrix Cloud thereafter.
Note: There have been some instances where Windows UAC has caused agent installs to fail. If you encounter a Failed to install agent error during blueprint deployment try disabling UAC on the template VM before.
If an Agent stops communicating with Smart Tools after a reboot, check to make sure the Smart Tools Agent Service is running. If it is, restart it and then check if communication is restored.
What information does Smart Tools have on your site?
Communication always flows from the Connector Agent on your Resource Location to Citrix Cloud. Because all machines reside in your Resource Location, Citrix Cloud does not store any sensitive data on their side. Smart Tools does however store the following information:
- Delivery Group and Machine Catalog GUIDs and names.
- Master VM names.
- Delivery Controller FQDNs, product version and IP addresses.
- VDA DNS names, UUIDs, the Load Index, Maintenance Mode status and power state of VMs to perform power management duties via Smart Scale.
- Site data uploaded to CIS by the customer through Call Home in XenApp and XenDesktop, Smart Check or through Citrix Scout.
The above data is stored in separate database instances for each customer.
The Citrix Cloud and Smart Tools service also stores other information, including passwords and usernames for authentication to Citrix Cloud, access to Resource Locations such as AWS and deployment of Blueprints to your Resource Location.
- Citrix Cloud credentials – The credentials you use to authenticate to Citrix Cloud are sent to the Citrix Online system. This process generates a one-time signed JSON Web Token and grants access to Smart Tools using this token.
- Resource Location Passwords and Secret Keys – Passwords (for on-premise) and Secret Keys (for cloud) needed for authentication to Resource Locations are stored, encrypted and salted in the Citrix Cloud service database. Citrix own the keys used to encrypt these credentials. After a customer enters a password or secret key through the Smart Tools portal, the password or key is masked and cannot be rendered in plain text.
- Credentials used in Blueprints – Blueprints can store credentials as an input parameter. These credentials are stored, encrypted and salted in the Citrix Cloud service database. Citrix own the keys used to encrypt these credentials.
- Citrix Site Administrator credentials – If you use Smart Scale and/or Smart Check on your Citrix Site, you are required to provide credentials to a Citrix Full Administrator account from that site. This allows Smart Tools to perform health checks, perform scaling actions and apply fixes and updates to Delivery Controllers and Machine Catalogs on your behalf. These credentials are stored, encrypted and salted in the Citrix Cloud service database. Citrix owns the keys used to encrypt these credentials. After a customer enters the password through the Smart Tools portal, the password is masked and canot be rendered in plain text.
- AWS key pairs – If AWS EC2 is one of your Resource Locations, Smart Tools prompts you to create a key pair if one does not exist. This key pair enables you to access any Smart Tools Blueprint provisioned resource. The public key is stored in your AWS account while the private key is managed by the customer and should be kept somewhere safe. Smart Tools does not store the private key.
- Machine image credentials – When deploying a Blueprint, the local administrator credentials you supply from the image template are stored in Citrix Cloud if you create a Deployment Profile. Smart Tools stores these credentials in a separate database instance for each customer. All encryption used by Citrix use standard-based encryption algorithms.
Note: Note that whilst some operations require credentials or keys, you do have the option of provisioning your own machines and using existing machines in the Resource Location when deploying Blueprints. Using existing machines will reduce the need to supply such information to Smart Tools if you prefer. Make sure each machine has the Smart Tools Agent installed before deploying a Blueprint. To download the Agent, visit Resources & Settings, begin to add a Resource Location but after downloading the Agent, cancel the Resource Location creation.
Adding users to Smart Tools
Firstly navigate to Identity and Access Management and then invite users of your choice. If invited users do not have a Citrix Cloud account they will be asked to create one.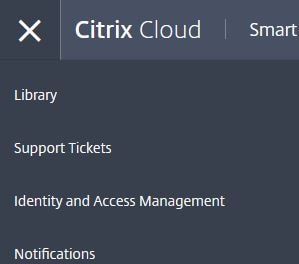
Type an email address and then click Invite. You can integrate Citrix Smart Tools with Azure AD. In this case you would have the ability to invite other Active Directory users. For a how-to see https://jgspiers.com/azure-active-directory-authentication-citrix-cloud/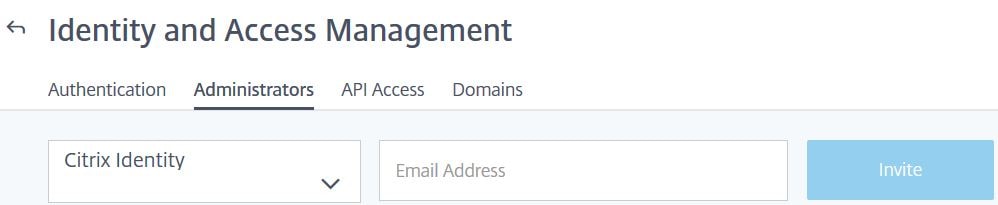
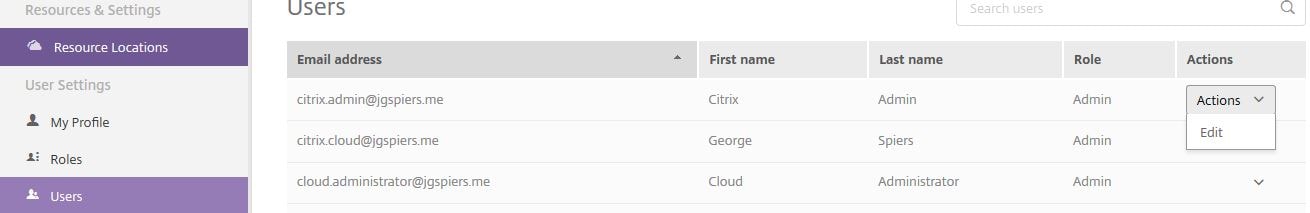
Once the invited user has signed up to Citrix Cloud they will be given the Admin role in Smart Tools. To change this, within Smart Tools navigate to Resources & Settings -> Users -> select a user and under Actions click Edit.
From there select the role of Admin, Architect or Operator. Click Save.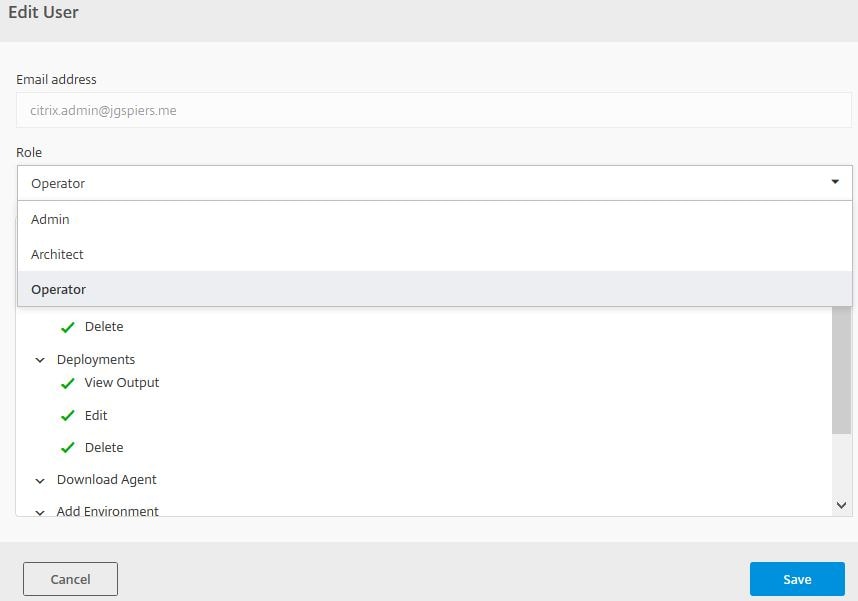
To remove a user from Citrix Cloud, navigate back to Identity and Access Management.
Create a Resource Location (Hyper-V) and install the Smart Tools Connector Agent (example):
As mentioned before, a number of pre-created templates (Blueprints) are available from Citrix Cloud that you can use to deploy full Citrix farms among other deployments. If a pre-created template doesn’t suit, you can customise it or create your own. In this example, I’ll show you how to configure a Deployment Profile, and use a pre-created Blueprint to deploy a fully configured Citrix farm. The farm consists of one VDA and one StoreFront/DDC bundled together server.
Log on to Citrix Cloud and under Smart Tools click Manage.
You’ll first need to deploy a Resource Location. The Resource Location is where your VDA and Citrix infrastructure servers will reside. The Resource Location can be on public (Azure/AWS) clouds or private clouds running Hyper-V, XenServer or vSphere. You can have multiple Resource Locations.
Click on Resources & Settings.
Click Add Resource Location. 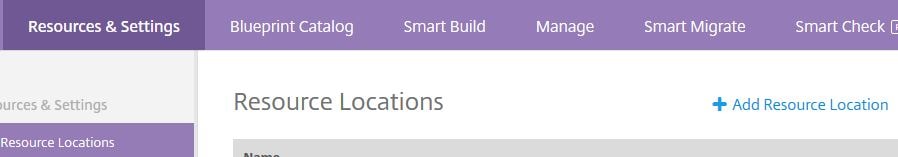
Check your hypervisor or cloud. In my case, Hyper-V. 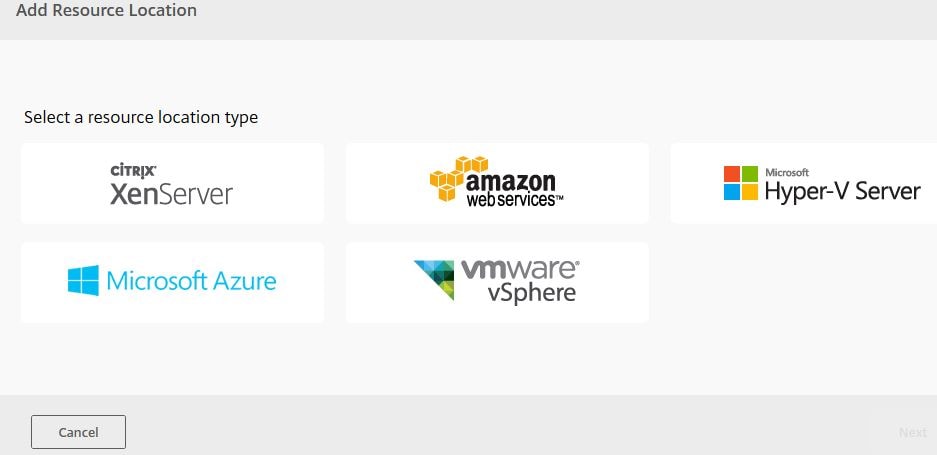
Click on Next. 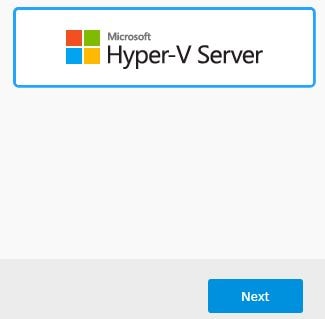
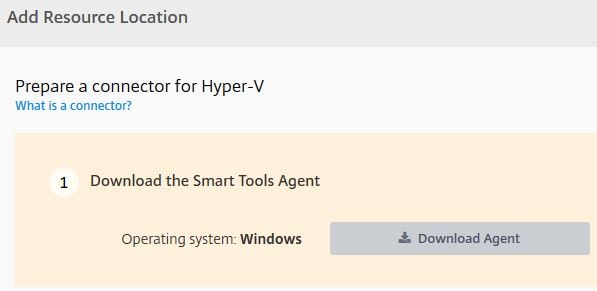
Click Download Agent. This downloads the Smart Tools Agent which you install on a dedicated machine within your resource location which will act as the connector. For high availability deploy pairs. These machines being connectors will broker communication from Citrix Cloud/Smart Tools to your Resource Location over HTTPS.
If you have multiple Resource Locations for example XenServer and vSphere, a connector on XenServer can act as the connector for the vSphere environment also providing it can communicate with machines in both Resource Locations.
The Smart Tools Agent can be installed on Windows 7 through to Windows 10 desktop OS (excluding Windows 8.1) or Windows Server 2008 through to Windows Server 2016 server OS. It can also be installed on a mixture of Linux OS.
Note: Also keep in mind that every machine the Citrix Cloud Smart Tools service has management over (machines deployed via Blueprints or manually added) will have a copy of the Smart Tools Agent installed. The agent is there to perform configuration tasks such as installing SQL, installing XenDesktop, creating a Citrix Site, running health checks for monitoring, gathering information and so on.
The installation instructions and requirements will be displayed. Along with a Waiting for you to install the Agent message. 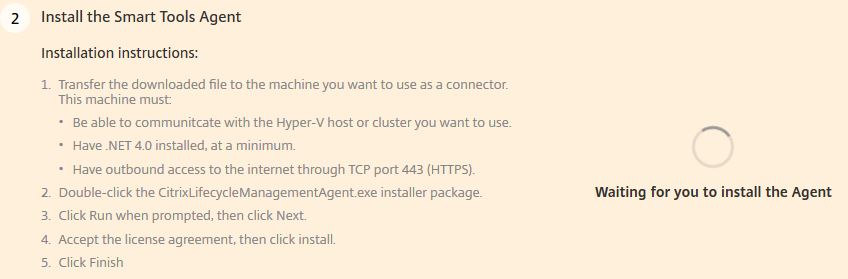
Within your Resource Location, on a connector machine, launch CitrixLifecycleManagementAgent.exe![]()
Accept the License Agreement and click Install. 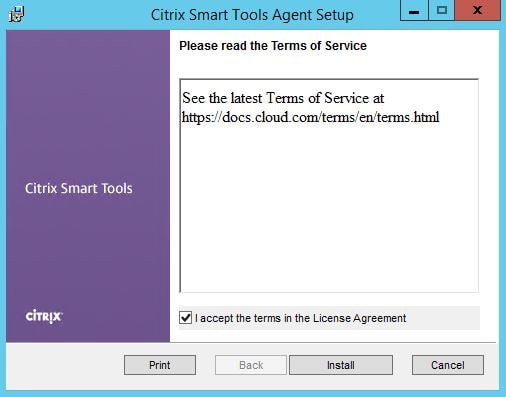
Click Finish. 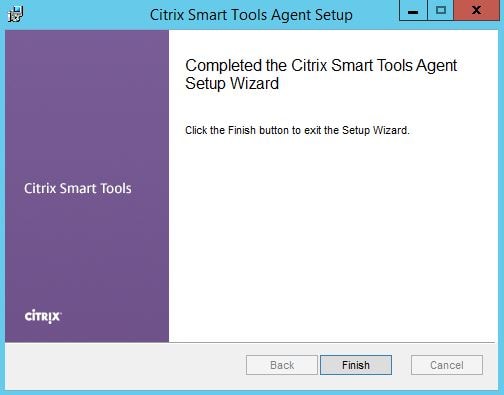
A log file is produced in case you need it. Return to the Citrix Cloud portal.![]()
At this stage Smart Tools should detect that a connector agent has been installed. You can now click Next. 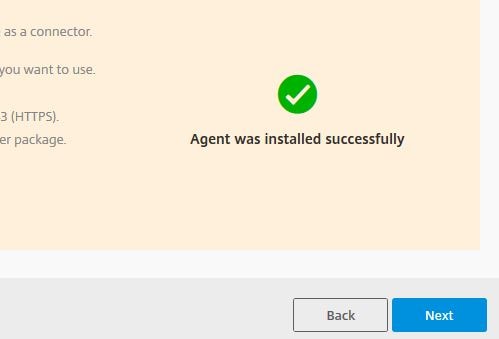
The new machine displays. To make it a connector, click on Use Selected Machine as Connector. A couple of additional scripts will be ran on the selected machine to promote it to a connector.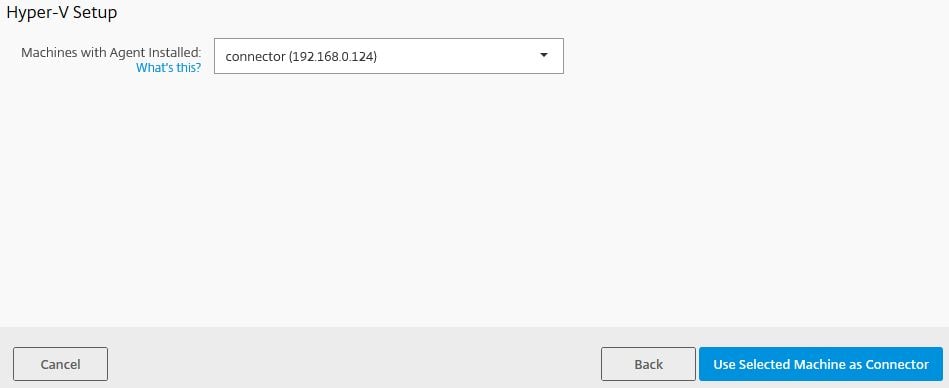
Making machine a connector. Please wait displays. 
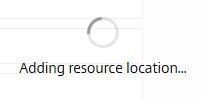
Once done enter Resource Location information. This includes a host (can be a connection to System Center Virtual Machine Manager/vCenter for example) or single host. Enter a username/password and domain name for an account that has permissions to manage the Resource Location. Click Add.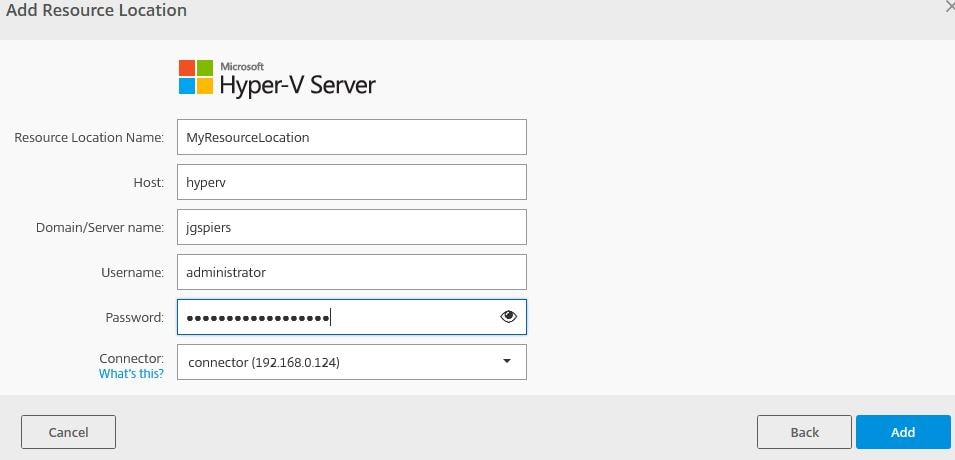
Once the Resource Location has been added, click Done. 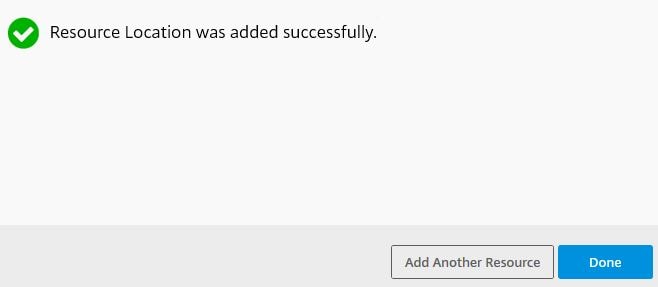
The Resource Location will always appear as below and can be edited. You can also add additional locations.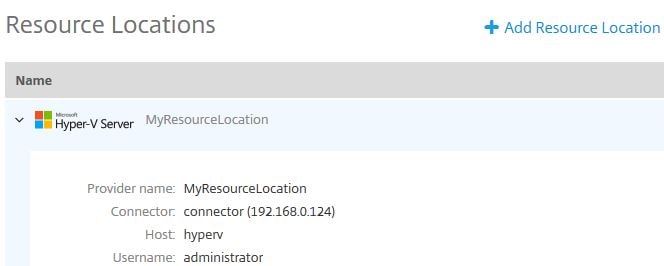
Enrolling site to Smart Tools when installing Delivery Controller (7.14+):
When installing a 7.14 or newer Delivery Controller, you are offered the option of joining Smart Tools at the end of the installation. This installs the Smart Tools Site agent and is not the same as the Site Agent connector you just installed previously when creating a Resource Location.
Before connecting to Smart Tools, disable IE ESC (IE Enhanced Security Configuration) for users and administrators via Server Manager. Once the Delivery Controller is connected to Smart Tools it is recommended to turn IE ESC back on.
Select I want to connect to Smart Tools and Call Home. (Recommended) and click Connect.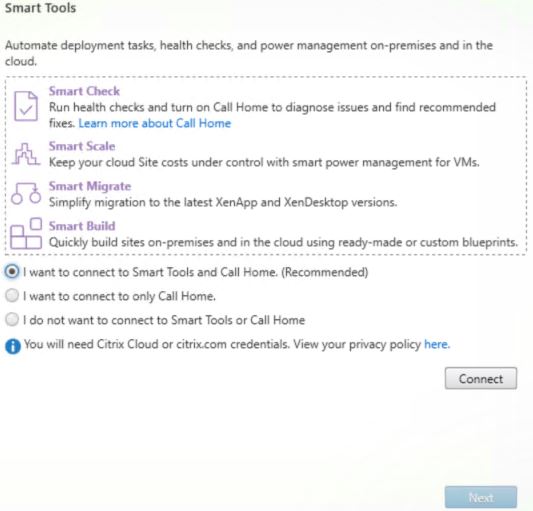
Enter your Citrix Cloud credentials and click Sign In. 
Once you see the success message, click Next. Finish the Delivery Controller install as normal, the site should now appear in Smart Tools. 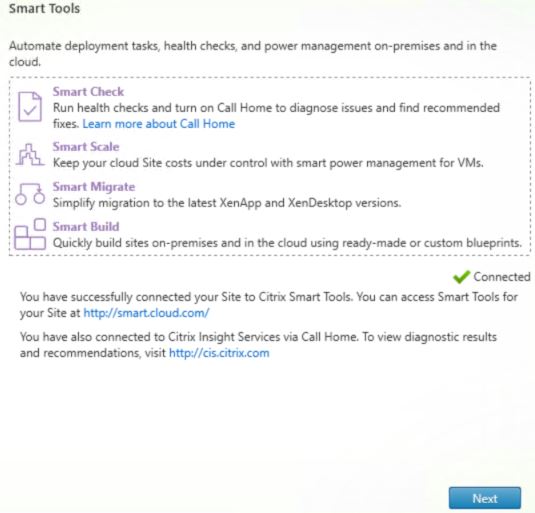
Citrix Smart Build (deprecated):
Using “Blueprints”, Smart Build allows you to automate the deployment and configuration of XenApp/XenDesktop etc. to various Resource Locations of your choice.
Smart Build (deprecated): Automated deployment of Citrix XenDesktop farm (example):
Now that we have a Resource Location, we want to build out a Citrix XenDesktop Site. To do that we use Blueprints either created by ourselves or via a pre-created template. In this example, I’ll use a simple PoC pre-created Blueprint. Click on Blueprint Catalog (now called Checks and Blueprints) and then choose the + symbol next to the Blueprint you want to use. From here forward the guide will reference the (Existing Domain) XenApp and XenDesktop Proof of Concept Blueprint created by Citrix.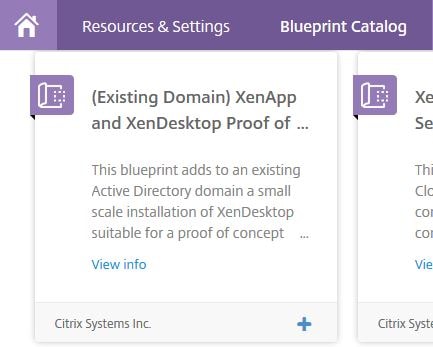
You’ll get a message indicating that the Blueprint has been added to your library.
Note: If a new update of a Blueprint is released, Smart Tools displauys an indicator so that you can update the existing Blueprint to the newer version.![]()
To access your library click Smart Build (deprecated). To start a deployment using the newly added Blueprint click Actions -> Deploy. 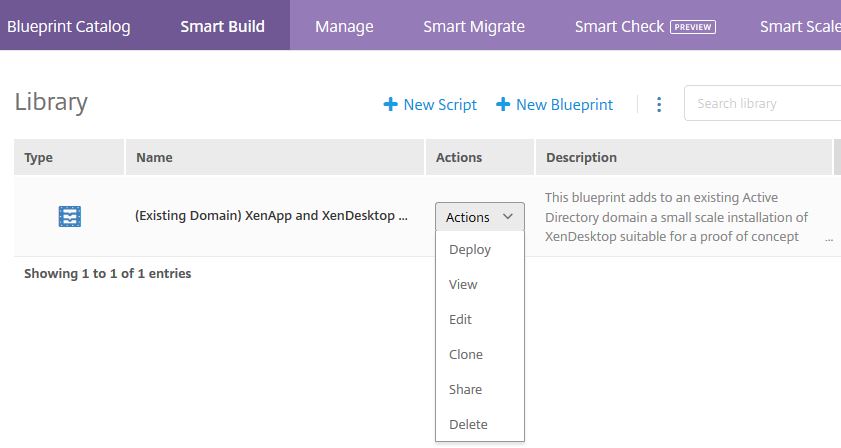
Click Start deployment setup. 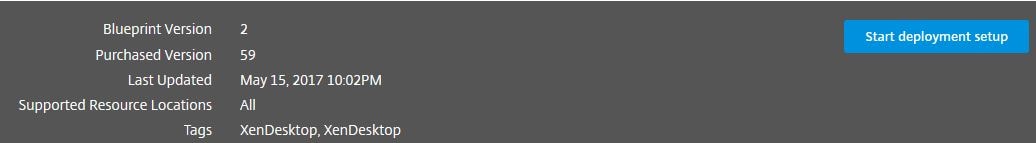
Enter a Deployment Name. You won’t have any created Deployment Profiles yet however during the next steps you do create one which can also be used in future deployments. Click Next.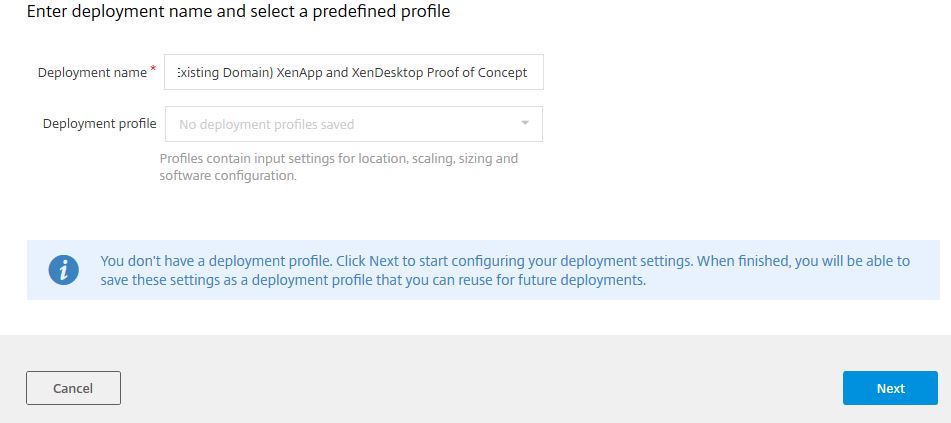
Select the Resource Location where you want to deploy to. The Resource Location you choose must be supported by the Blueprint you are deploying. Click Next.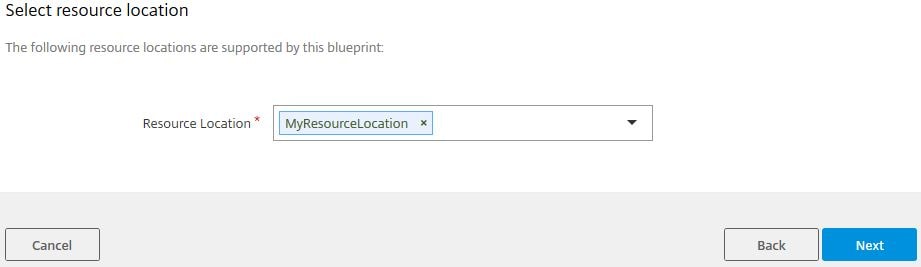
You have the option to configure NetScaler as part of the deployment. Something I am not going to do at this time. Click Next. 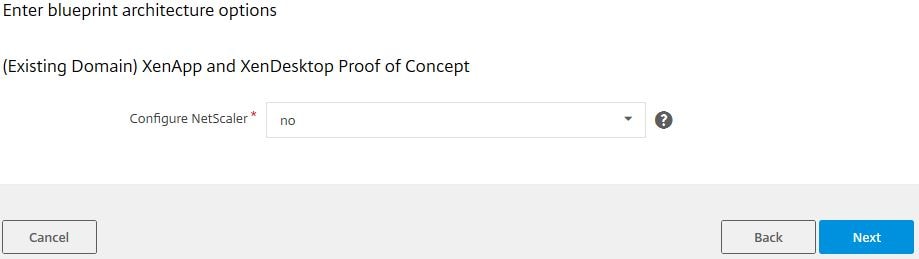
A number of pre-deployment checklist points will be displayed to help you prepare for the deployment. 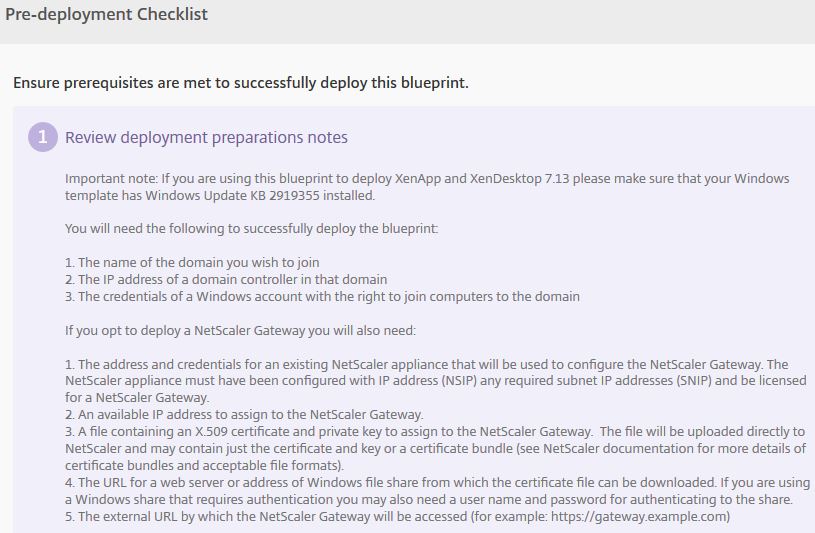
Also the recommended hardware specs for each machine you are deploying will be displayed.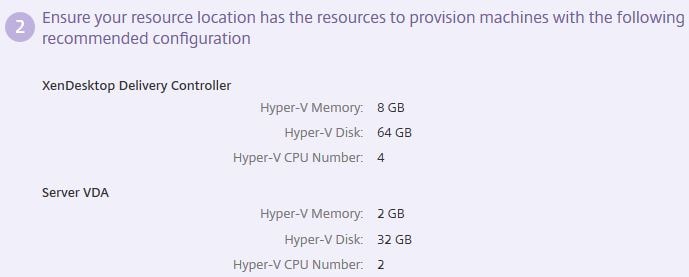
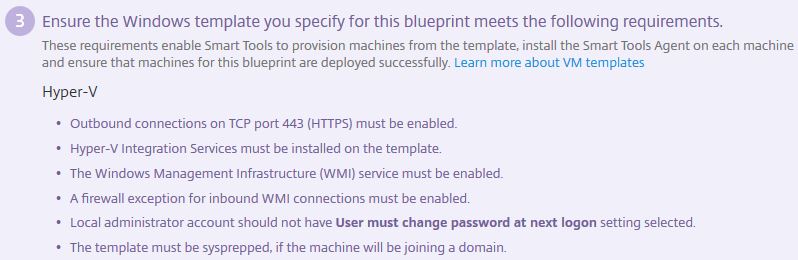
During the deployment, the machines created by the Blueprint are built off a template disk(s) that you create. On your Resource Location, you create a template virtual machine and configure it as per the requirements listed below for Hyper-V. This includes:
- Patching the image with the latest updates.
- Ensuring the WMI service is enabled and started.
- Ensuring outbound connections on TCP 443 are possible.
- Allowing inbound WMI traffic through Windows firewall.
- Ensuring the Hyper-V Integration Services are installed on the machine. Ensuring a local administrator account is created with a password that does not prompt for change on next log on.
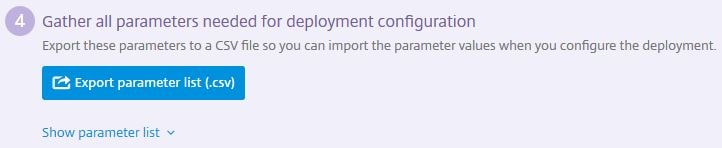
As with any automated deployment, a number of parameters are needed for the configuration piece. Using the Export parameter list (.csv) option allows you to fill out any parameters in to CSV format and upload them to the deployment wizard. Instead I will define the parameters during the wizard manually. Before clicking Continue on the wizard, let’s create a template machine.
Create a template machine for Blueprint deployment:
Over on your Resource Location, create a template machine using hardware configurations of your choice. Later in the deployment you’ll be able to choose the hardware specifications for each machine the Blueprint deploys. Also make sure to patch Windows with the latest updates. You can use seperate templates for DDC and VDA if you wish. In my example, I am using a Windows Server 2012 R2 image for both machines.
An example where you would have two is if you are using a different OS for your VDAs, or you want the blueprint to deploy applications on your behalf to Delivery Groups. This would require you install applications on the VDA template machine.
Note: Do not install the Smart Tools Agent on the machine. The Agent is deployed automatically during Blueprint deployment.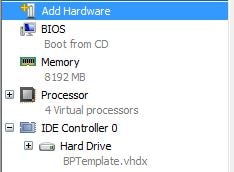
Make sure the local admininstrator account is not set to change password at next logon. Also do not join the machine to your domain.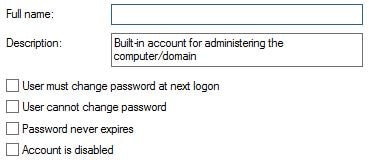
Make sure the Windows Management Instrumentation service is running and automatic.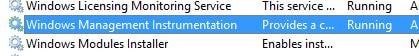
Check that the Hyper-V Integration Services component is installed and up-to-date. Also make sure the services are up and running.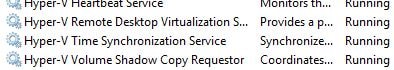
Launch Windows Firewall with Advanced Security and right-click Inbound Rules -> New Rule.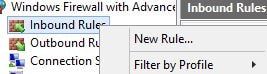
Under Predefined select Windows Management Instrumentation (WMI). Click Next. 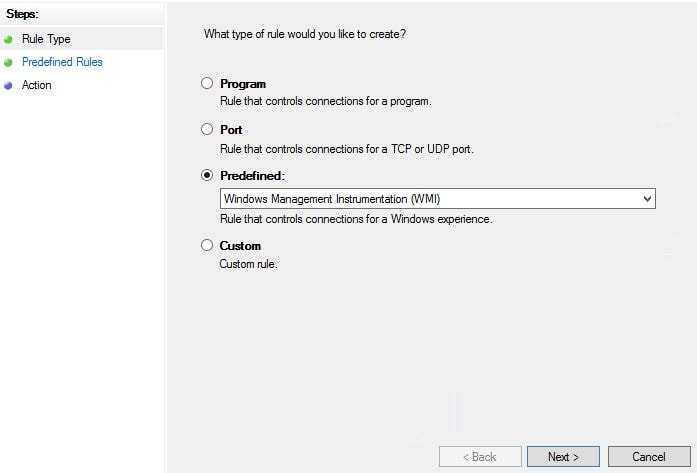
Check all three rules and click Next. The rules already exist but they are disabled. Completing this wizard will enable them for you. 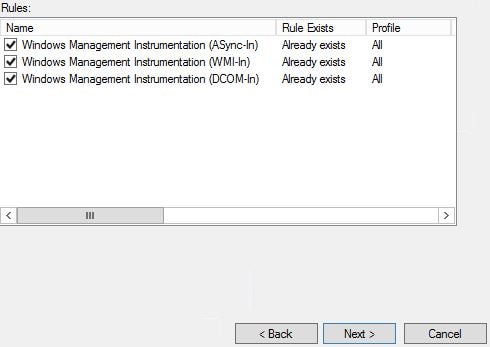
Click Finish. 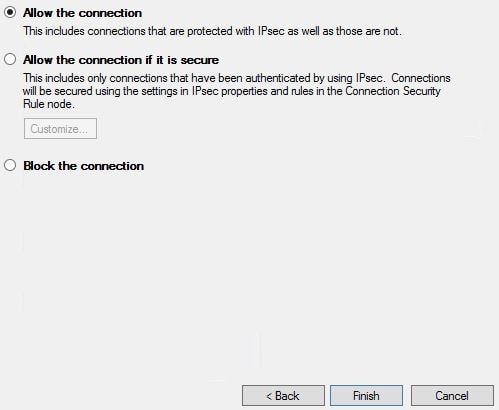
If you don’t want to run through the wizard, highlight all three rules and right-click then select Enable Rule. Allowing WMI traffic through the firewall allows the Smart Tools Agent to install. 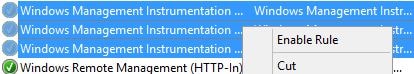
Make sure you have an unattend file created. As an example, the file I used is below.![]()
Example unattend file:
language="neutral" versionScope="nonSxS" xmlns:wcm="http://schemas.microsoft.com/WMIConfig/2002/State" xmlns:xsi="http://www.w3.org/2001/XMLSchema-instance">
            <OOBE>
                <HideEULAPage>true</HideEULAPage>
            </OOBE>
            <UserAccounts>
                <AdministratorPassword>
                    <Value>TABpAHYAZQByAHAAbwBvAGwAMAAxAEEAZABtAGkAbgBpAHMAdAByAGEAdABvAHIAUABhAHMAcwB3AG8AcgBkAA==</Value>
                    <PlainText>false</PlainText>
                </AdministratorPassword>
            </UserAccounts>
        </component>
    </settings>
    <settings pass="specialize">
        <component name="Microsoft-Windows-Shell-Setup" processorArchitecture="x86" publicKeyToken="31bf3856ad364e35" language="neutral" versionScope="nonSxS" xmlns:wcm="http://schemas.microsoft.com/WMIConfig/2002/State" xmlns:xsi="http://www.w3.org/2001/XMLSchema-instance">
            <ProductKey>D2N9P-3P6X9-2R39C-7RTCD-MDVJX</ProductKey>
        </component>
    </settings>
    <cpi:offlineImage cpi:source="wim:c:/users/g_liv/downloads/install.wim#Windows Server 2012 R2 SERVERSTANDARD" xmlns:cpi="urn:schemas-microsoft-com:cpi" />
</unattend>
Open CMD and change directory to C:\Windows\System32\Sysprep. Run command sysprep /generalize /oobe /shutdown /mode:vm /unattend:c:\unattend.xml. At this stage unattend.xml file will be copied to the C:\Windows\Panther directory, the machine will be sysprepped and shut down. Return back to the Citrix Cloud portal.![]()
Now you can click Continue. 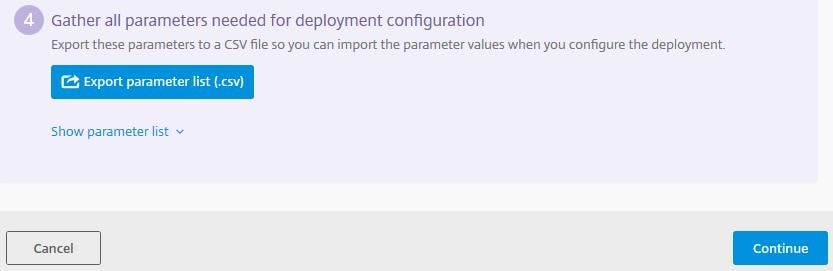
On the scaling screen nothing can be changed when using this Blueprint because the functionality to change has been disabled on this Blueprint. You can edit the Blueprint as previously mentioned to further suit your requirements. Click Next. 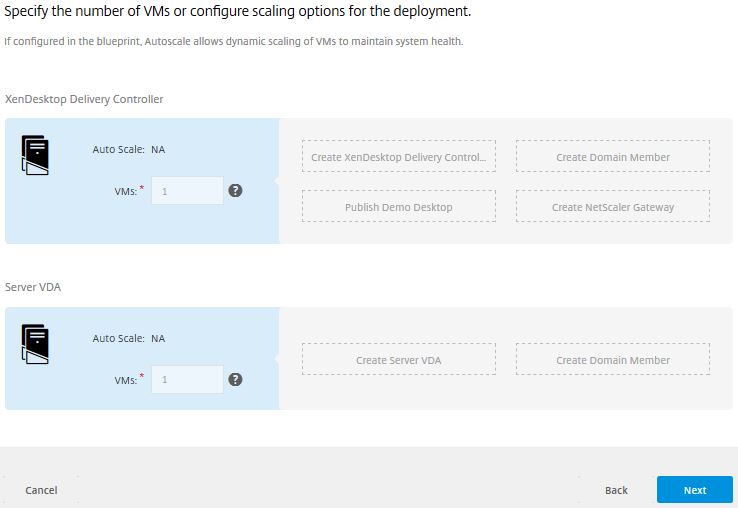
Under XenDesktop Delivery Controller choose the Resource Location you had created earlier. 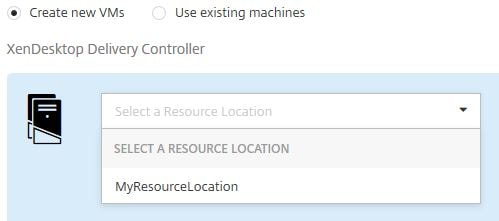
Specify a computer name for the Delivery Controller. Click Next.
Now you have to specify the location to your template virtual disk (.vhd) file that has been prepared for imaging. The Blueprint deployment will make copies of this disk when creating the DDC and VDA. By default copies of this disk will also be stored on E:\ however you can use the Edit button to change this location to elsewhere. Once you have filled out your VHD location, click Get Disk Info. If the disk is found, you’ll be displayed with disk specific information such as Disk Type, Disk Size, Disk Format. Click Next.
Here you get to configure the machine system hardware and a static IP if desired. Obviously a static IP is a must for the Delivery Controller so enter the required information and click Next. 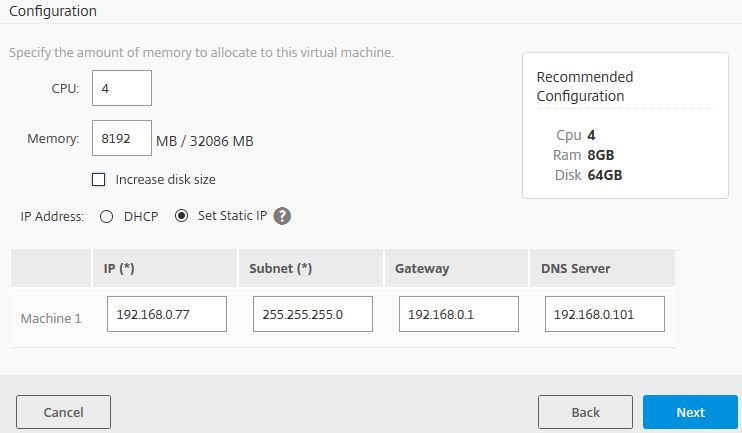
As mentioned before, any machine deployed by a Blueprint will receive an install of the Citrix Smart Tools Agent so that it can be managed. You can see the checkbox towards the top states that an agent will be installed. Enter credentials to the local administrator account of the template machine and click Next.
Review your configuration information and click Finish. 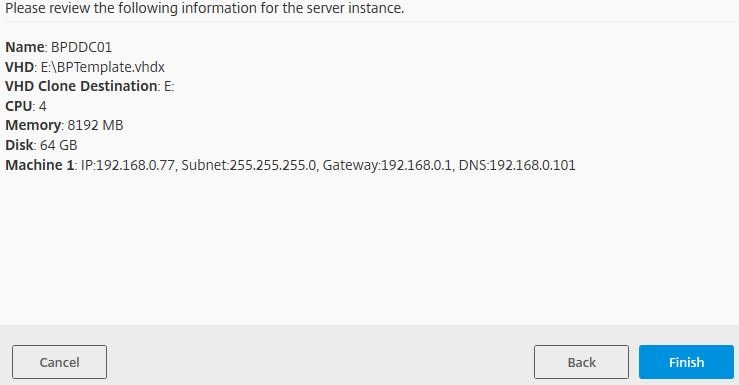
Now you have to perform the same steps for the VDA machine. Select your Resource Location. As you can probably tell, it is possible to deploy machines to multiple Resource Locations.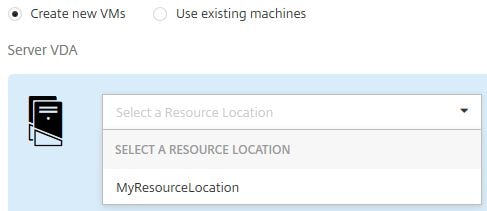
Enter the VDA machine name, click Next. 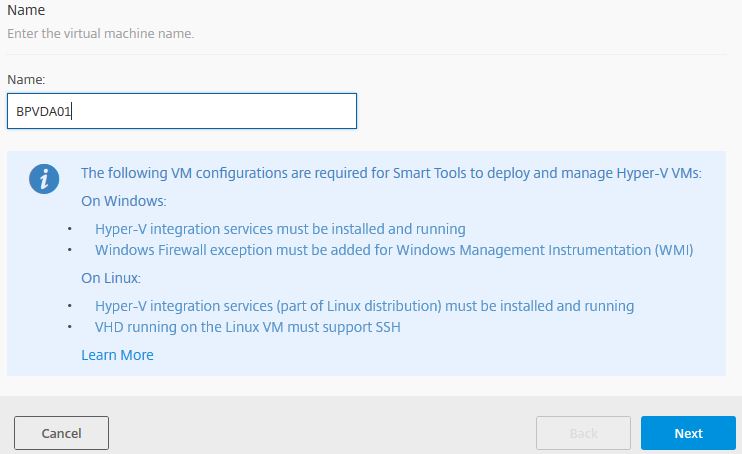
Enter disk information, click Next. 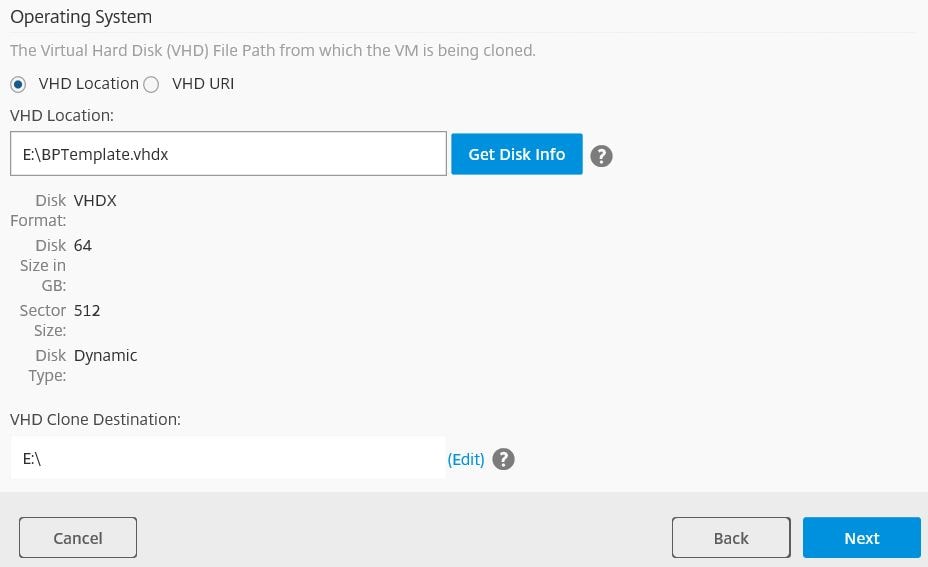
Enter hardware specification, select DHCP. Click Next. 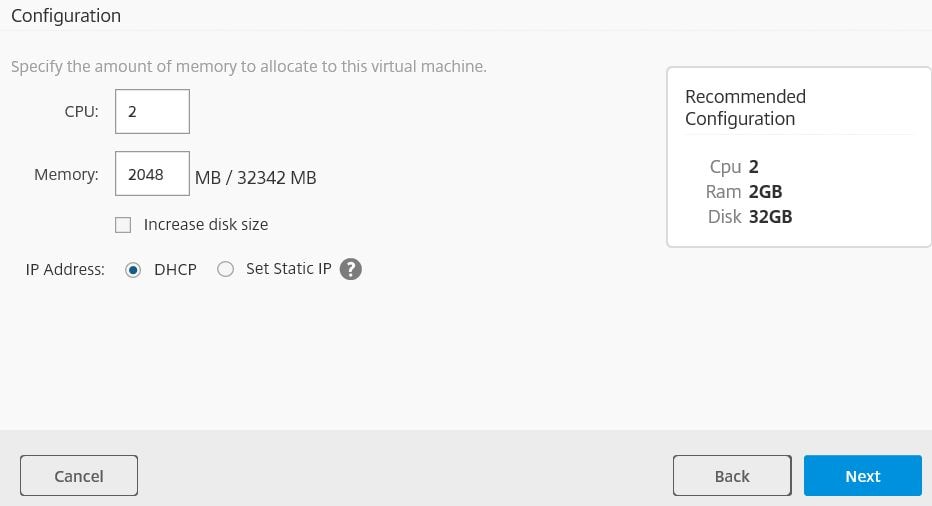
Enter local administrator credentials. Click Next. 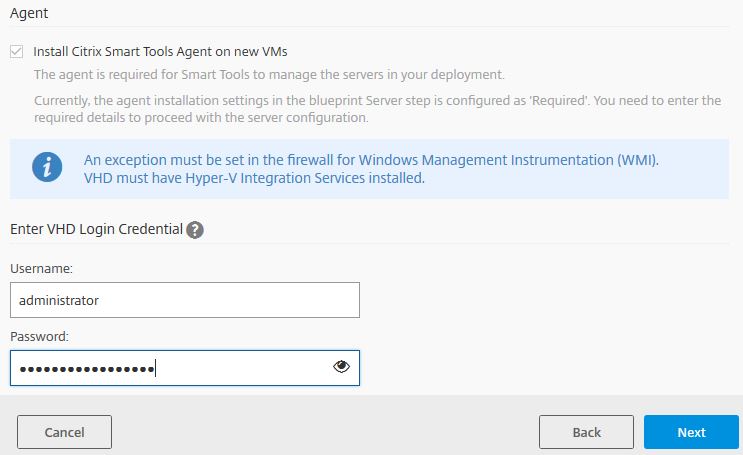
Click Finish. 
Click Next. 
There are some more configuration parameters needing entered before we can start the depoyment.
- Fill out the IP of a Domain Controller.
- FQDN of domain name.
- Administrator account that has the privileges to install XenDesktop on the VDA/DDC and join those machines to the domain.
- XenDesktop site name.
- Computer name for the DDC.
- ISO location of XenDesktop 7.13/7.14 media.
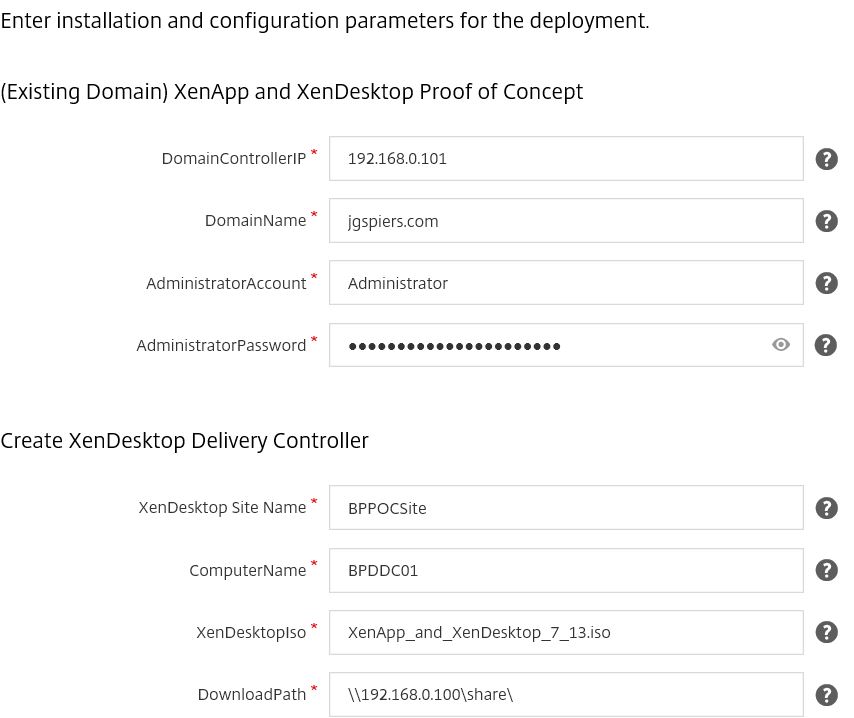
You may also need to enter credentials if you use a CIFS share. Finally the remaining field allow you to change the ComputerName, create a VDI server desktop and change the PowerShell Execution Policy.
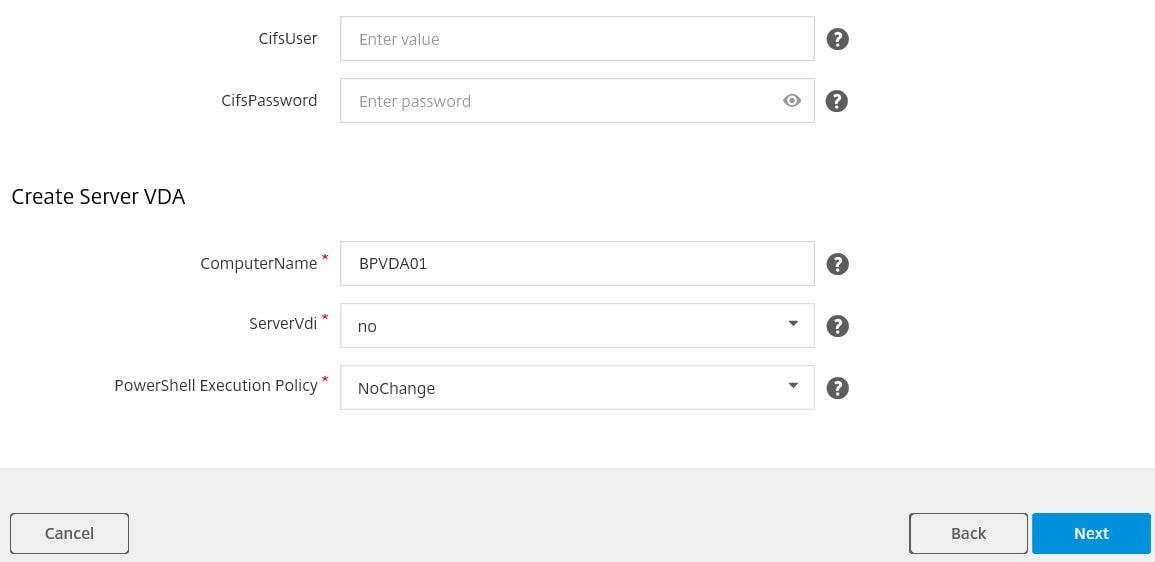
The execution policy can be changed on your server VDA to one of the following values. I will leave all values at default. Click Next. 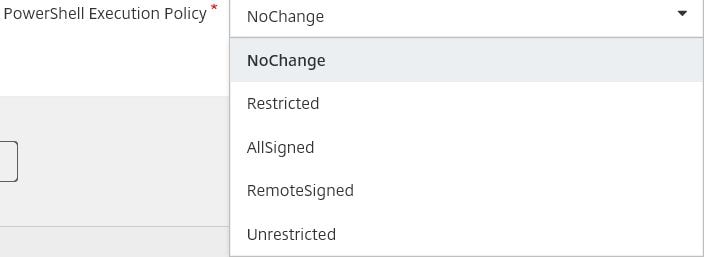
You’ll be asked to specify a Deployment Profile name and to save it. This profile can be used to redeploy this Blueprint at a later time. You don’t have to save it. Enter a name, description and click Save.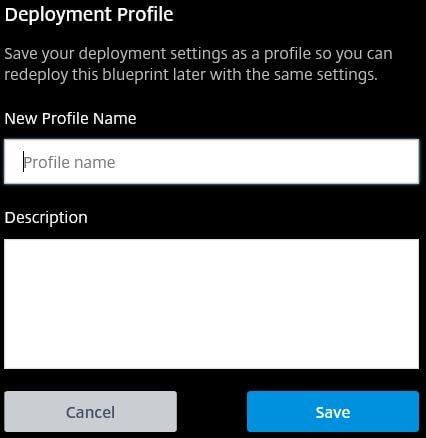
Now click Deploy. 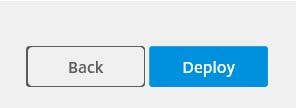
As the Blueprint deploys, you’ll see a number of deployment steps being performed containing valueable information. Click each step and you can view the Step Details and Step Output. In this example, the initial task involves making a copy of the template machine disk to accomodate deploying our Delivery Controller.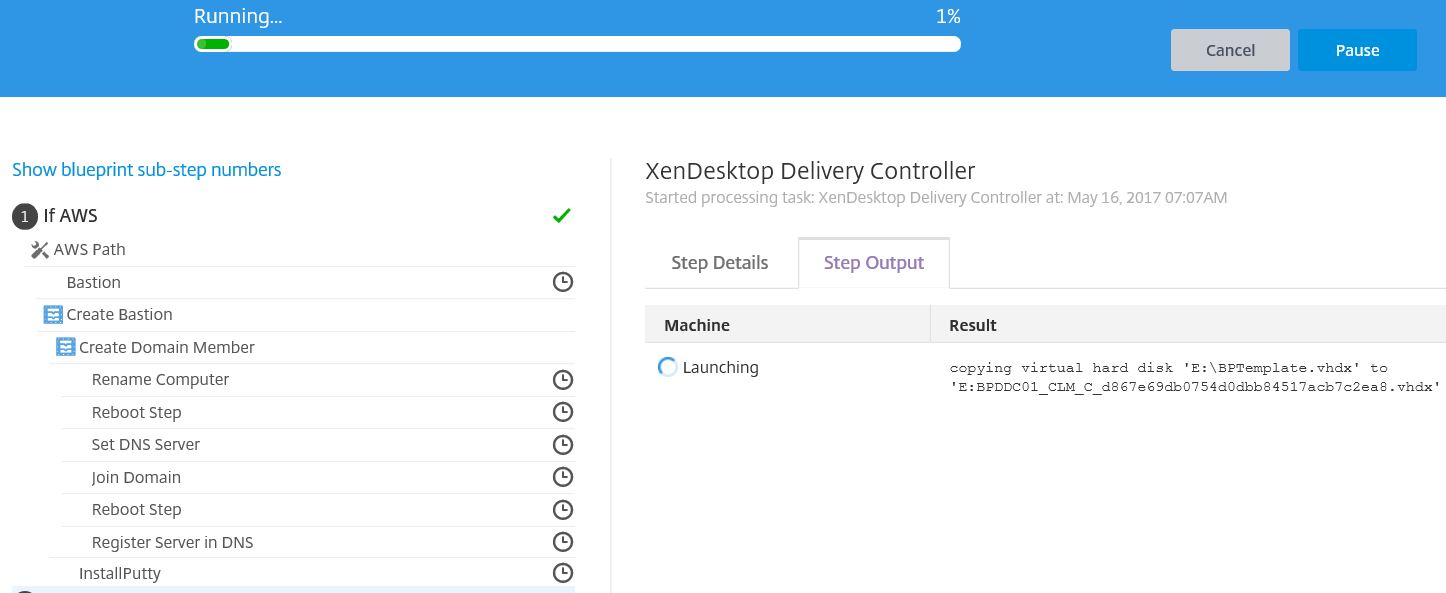
The Delivery Controller will be created over on your Resource Location, with the disk attached and hardware configuration complete. ![]()
The machine goes through a number of configuration steps, one involving the installation of the Smart Tools Agent on to the Delivery Controller. 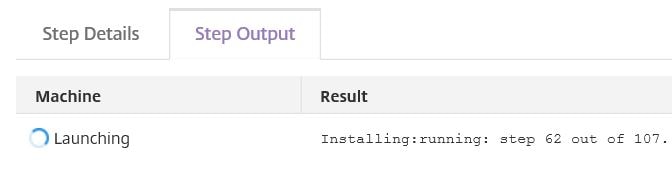
As you can see here the Delivery Controller was renamed to BPDDC01. That step took 21 seconds.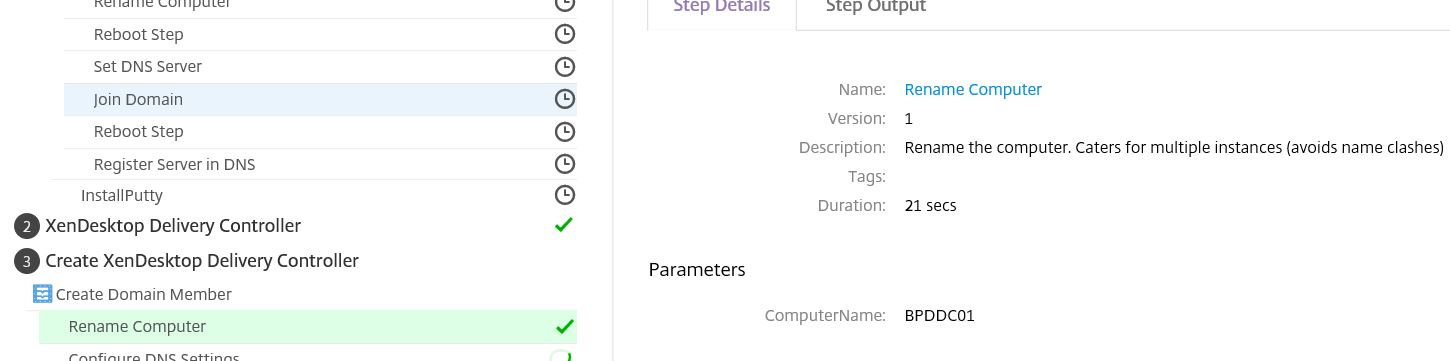
The Step Output tab shows the old machine name and the new machine name.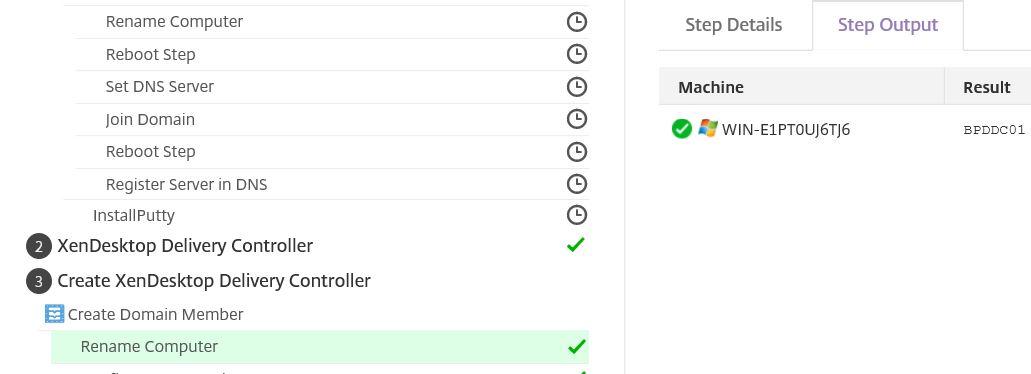
Reboots are a frequent step in the deployment process. Here you can see a reboot and check for successful reboot occuring.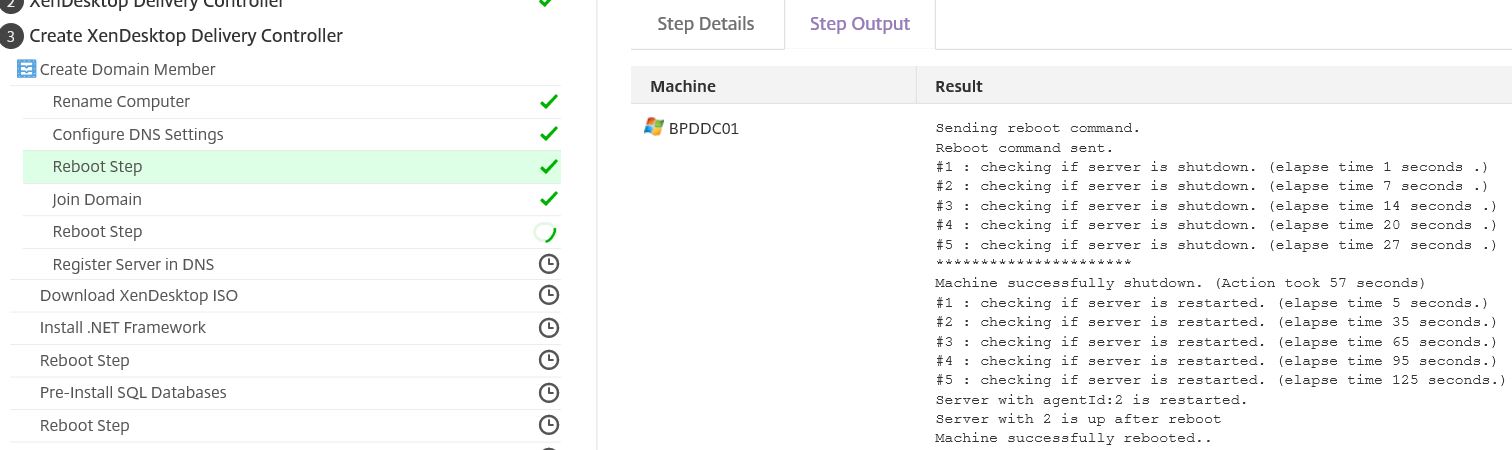
The machine goes through a number other configuration steps such as the configuration of DNS settings and joining to the domain.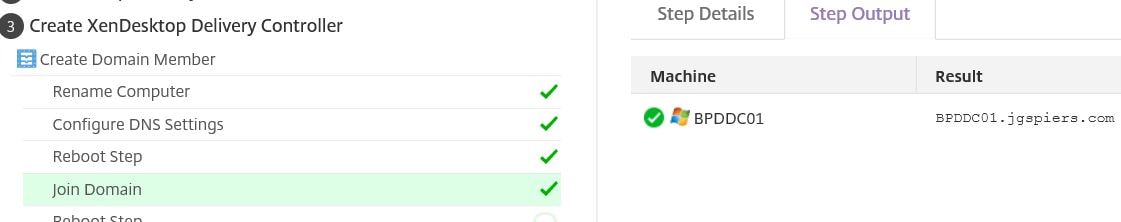
Once the machine is ready for a XenDesktop install, the ISO is copied from the share you provided earlier to the machine locally in C:\Installers. 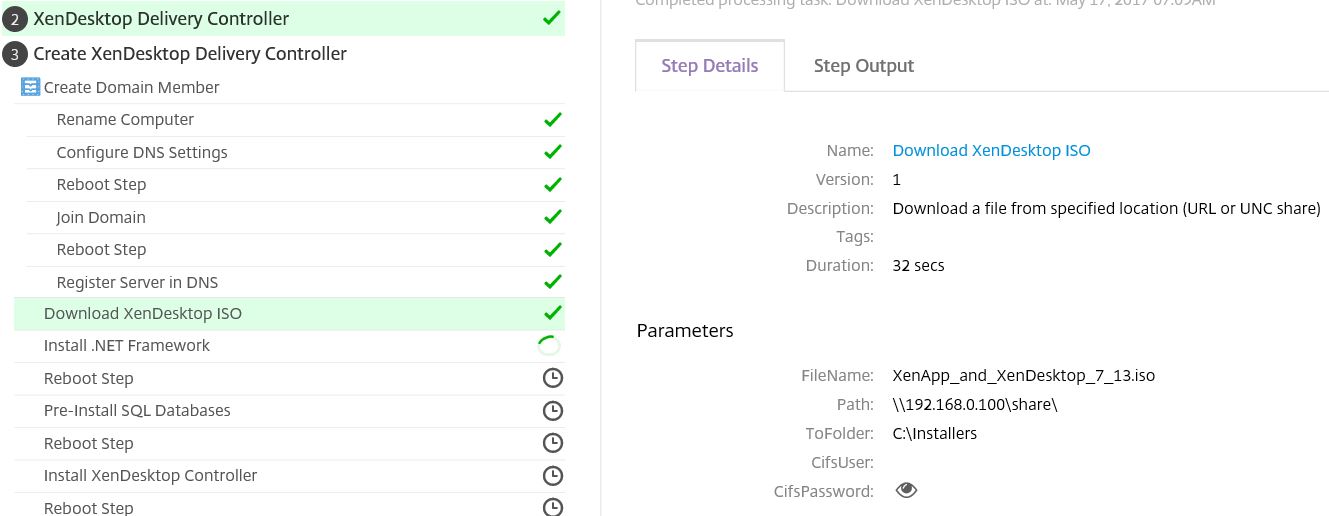
Just to confirm, the XenDesktop 7.13 media shows under the Installers folder on the DDC that is being deployed by Smart Build. 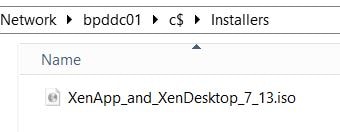
After a number of steps, the Delivery Controller install is complete, a SQL instance (in this case SQL Express) is installed and a Citrix site created along with the require databases. The XenDesktop Delivery Controller machine has at this stage finished installing and is configured with a XenDesktop Site. Next up is the install and configuration of the VDA, it goes through a number of the same steps so I’ll not repeat any of that process.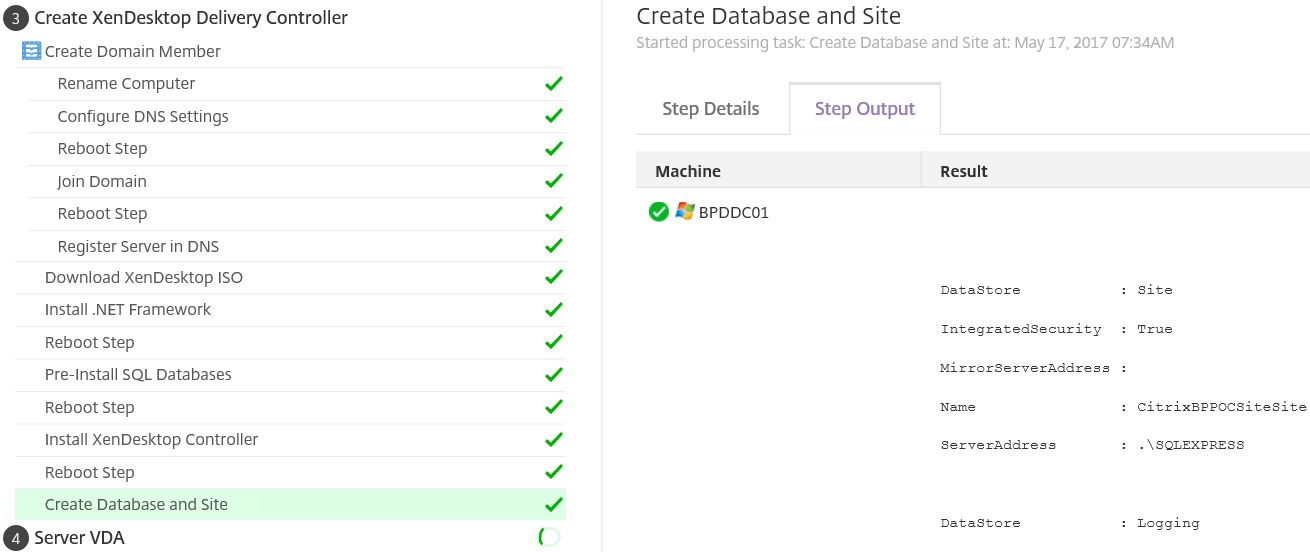
Once the VDA is complete, the deployment will return as complete. You can now perform a quick check to make sure everything looks OK.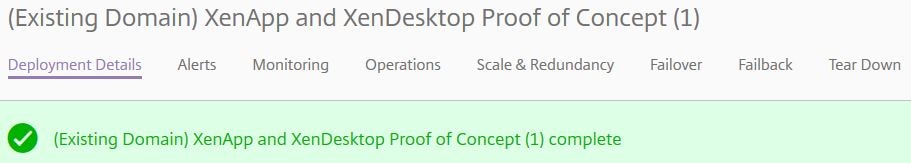
Here are the two machines the Blueprint deployed, showing the correct amount of memory. ![]()
Launching Citrix Studio on the Delivery Controller, you can see a BPPOCSite was created (that name was specified in the Deployment Profile) and that a Delivery Group has been created.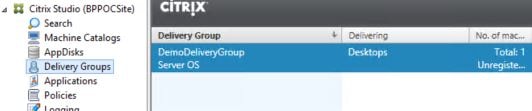
Inside the Delivery Group is the VDA, registered successfully. 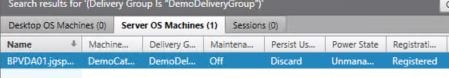
In this example StoreFront is also installed on the Delivey Controller and an HTTP store created. 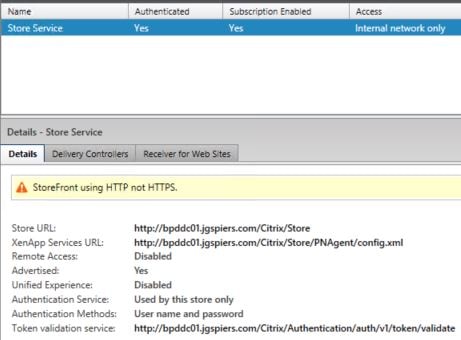
To confirm connections can be made, connect to Receiver for Web and check you can successfully launch a desktop.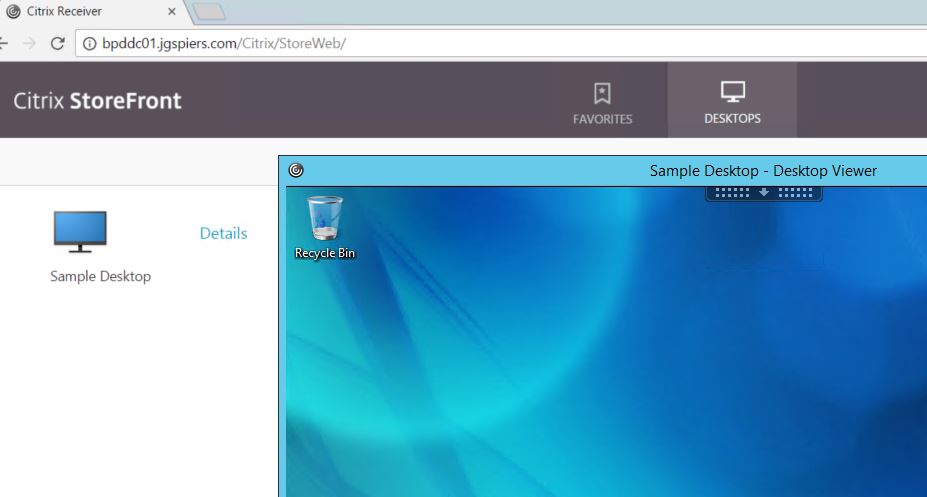
Pausing or retrying failed Blueprint deployment steps:
If your Blueprint fails at any step, you might want to pause the deployment to correct or retry the same step again. This is just a case of telling the Blueprint what action you want it to take on failure. Navigate to Smart Build, click Actions on your desired Blueprint and click Edit.
Now under Options click on the On failure drop-down box to select your desired outcome. During the deployment you will have more options on how you wish to proceed based on the On failure option you choose. 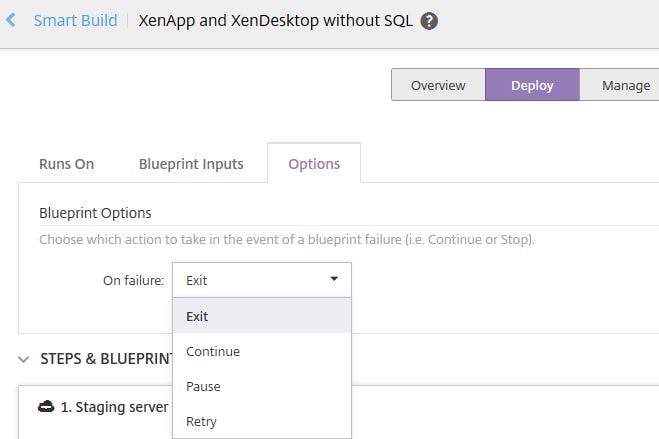
Troubleshooting a failed Blueprint Deployment:
Citrix have published a number of tips to diagnose deployment issues. See https://manage-docs.citrix.com/hc/en-us/articles/212715043-Troubleshoot-blueprint-deployment-issues
How to delete a Deployment Profile:
To delete a Deployment Profile, click Smart Build and start to deploy a Blueprint until the stage where it asks you if you want to use an existing Deployment Profile. Click the drop-down and click X beside the Deployment Profile you want to delete.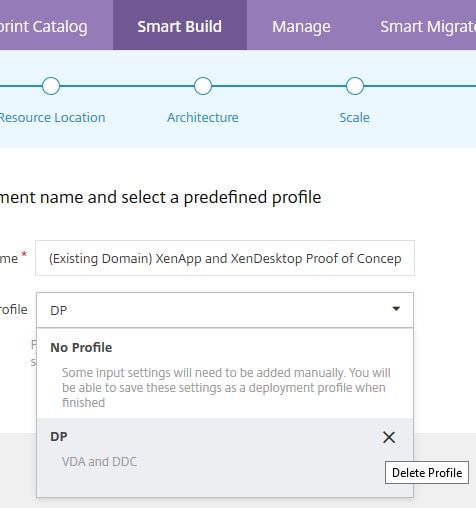
Citrix Smart Check:
Smart Check is a new Smart Tools product that is currently in preview. From a high level Smart Check provides health monitoring for your Citrix environment.
- You get notifications about recommended fixes and issues found in your environment during regular health checks and health check reports.
- Smart Check can manage updates to your environment including which updates are pushed out and when.
- You can schedule a range of health checks, which are then ran automatically.
- View health reports for your Citrix sites and upload diagnostic data to Citrix Insight Services.
How does Smart Check work?:
Smart Check works by running one or more collectors on Delivery Controller(s) within your Resource Location. A collector is no more than a script or tool mostly run within PowerShell which is run by the Smart Tools Agent. The data collected in this step is formatted mostly in JSON files but at times XML files and then uploaded to Citrix Insight Services for analysis. Based on the analysis results, alerts may be generated for a number of conditions.
What data does Smart Check collect?:
JSON files that are generated by Smart Checks are very small in size containing little data other than information to identify your Site, the issues that have been alerted and the names of affected VDAs.
For example the Apps and Desktops Health Check gathers your version of XenApp/XenDesktop, the Site name, any affected VDAs including name, OS version and what errors exist on those VDAs.
Smart Check System Requirements:
Smart Check is supported on the following platforms:
- XenApp and XenDesktop 7.6 LTSR and 7.11.
- XenApp and XenDesktop deployments running on:
- Azure ARM.
- AWS.
- XenServer 6.2 -> 7.1.
- VMware vSphere 5.1, 5.5 and 6.0.
- Machine Catalogs that use MCS.
- Smart Check is not supported on deployments that use the XenApp and XenDesktop Service in Citrix Cloud.
- To use Smart Check, Delivery Controllers that run the Smart Tools Site Agent must support PowerShell 3.0 and be able to communicate with Citrix Cloud over HTTPS 443.
- Smart Check reports on XenApp and XenDesktop Delivery Controllers, Delivery Groups and Machine Catalogs only.
What checks does Smart Check perform?:
Smart Check runs the following types of health checks:
- Site Health Checks – These checks are run on your Delivery Controllers. It is recommended that you run this check daily. Some of the checks include:
- Checking that Windows Firewall rules are enabled.
- Host connection is not in Maintenance Mode.
- Citrix Monitor Service can access the Monitoring database.
- Recent database backup exists.
- Connectivity to core XenApp or XenDesktop services are established.
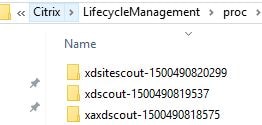
- Site Health Check log files are stored on your Delivery Controller(s) in C:\Program Files (x86)\Citrix\LifecycleManagement\proc\xdsitescout-<timestamp>. Log files are deleted after 5 days.
- Apps and Desktops Health Checks – This check ensures that your Delivery Groups are available to serve applications and/or desktops.
- Apps and Desktops Health Check log files are stored on your Delivery Controller(s) in C:\Program Files (x86)\Citrix\LifecycleManagement\proc\xaxdscout-<timestamp>. Log files are deleted after 5 days.
- Update Checks – This check runs on your VDAs and Delivery Controllers to see if they have the latest patches installed. If not, patches are recommended.
- Update Check log files are stored on your Delivery Controller(s) in C:\Program Files (x86)\Citrix\LifecycleManagement\proc\xdscout-<timestamp>. Log files are deleted after 5 days.
- LTSR Checks – Checks your Delivery Controllers and VDAs to determine if they are LTSR compliant. This check runs the LTSR Assistant tool against your site – https://support.citrix.com/article/CTX209577. For this check to run successfully, make sure the following conditions are met on your VDAs and Delivery Controllers:
- PowerShell 2.0 and above is supported.
- ICMP is allowed inbound through Windows Firewall.
- WinRM is enabled through Windows Firewall and the service is started (also an Agent requirement).
- Port 80 is allowed on Delivery Controllers for the XenApp and XenDesktop PowerShell SDK.
- Port 5985 is allowed on VDAs and Delivery Controllers for Windows RM.
- StoreFront Checks
- Validates certificates for StoreFront.
- Validates StoreFront service status, AD connectivity, base URL setting, and IIS Application Pool version.
- Provisioning Services Checks
- Validates PVS status and checks several aspects of the Provisioning Services configuration.
- Citrix License Server Checks
- Verifies License Server status, Subscription Advantage eligibility date compatibility and provides license upgrade suggestions.
- Life-cycle Checks
- Verifies End-of-Life and End-of-Maintenance status on Delivery Controllers and other Site components.
- Provides LTSR and Current Release update recommendations.
Note: There are some custom checks that can be run such as a VDA health check. This check makes use of the VDA health assistant tool found here.
Note: For a list of Citrix provided alerts included in Smart Check see https://manage-docs.citrix.com/hc/en-us/articles/115000817343-Smart-Check-alerts-reference
Additional custom health checks (VDA Health Check)
You can add custom health checks to Smart Check by way of blueprints. This allows you to add some additional checks on top of the four main checks that are already available. In this example, I’ll add the VDA Health Check blueprint to my list of checks that can be performed via Smart Check. This health check uses the VDA Health Assistant tool.
Browse to Blueprint Catalog (now called Checks and Blueprints), scroll to the bottom and click the + under VDA Health Checks.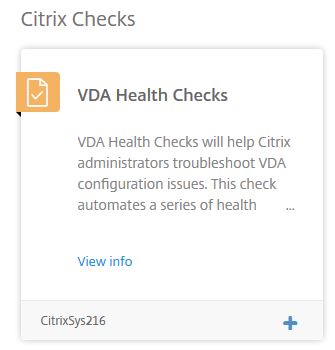
Now navigate back to Smart Check and under Perform Check you’ll have the new option to run VDA Health Checks. 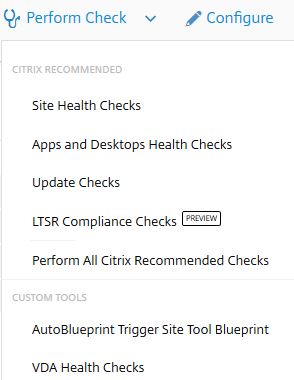
When you click to run this check, you can pick and choose which VDAs you want to run it against. Enter credentials and click Perform Checks Now.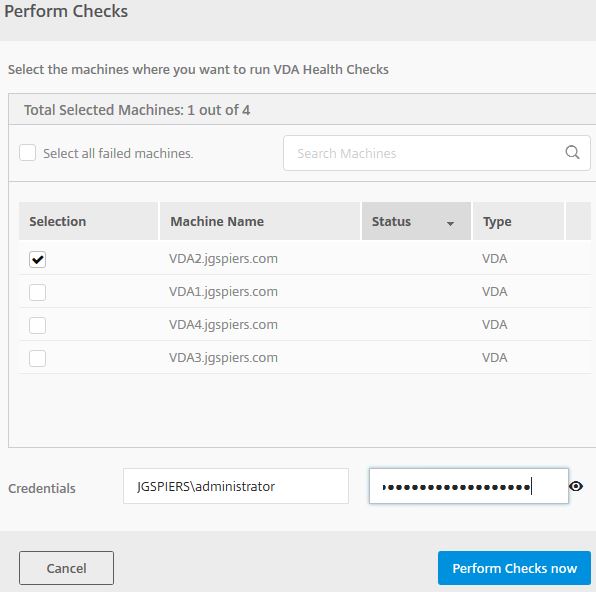
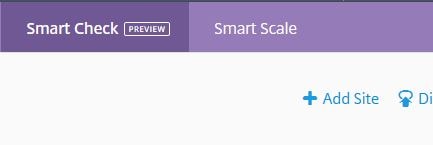
Add Site to Smart Check:
Note: Sites can be added the following ways:
- A site deployed via Blueprints that has the Register Site step is added to Smart Check for you.
- If you use Call Home or upload Citrix Scout reports to CIS using the same MyCitrix account you use for Smart Tools. Likewise if you upload diagnostic files to CIS via Smart Check (explained later).
- Note: Automatic Site Discovery is switched off by default for Call Home or Citrix Scout diagnostics uploads to CIS. Previously, it was enabled by default.
Alternatively, you can add an existing site manually.
To manually add an existing site to Smart Check, click Start Check -> Add Site.
Click Download Agent to download the Start Check Site Agent.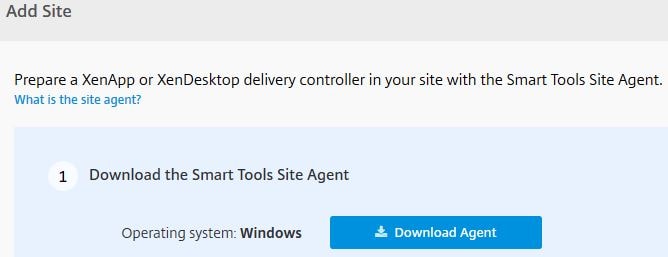
Install the Site Agent on a Delivery Controller in the site you want managed. It is recommended to install the Site Agent on multiple Delivery Controller’s in your site for high availability.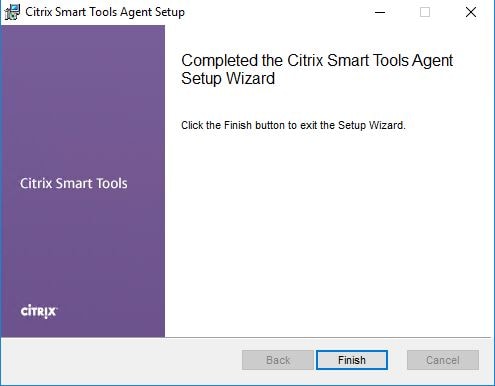
Once the Site Agent is installed on a Delivery Controller, return to the Citrix Cloud portal and you should receive the Agent was successfully installed message. Click Next.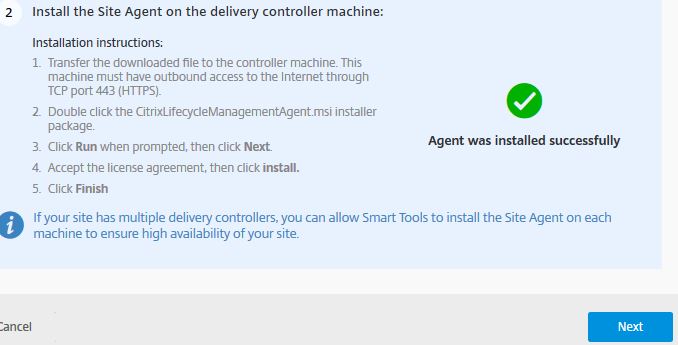
Enter credentials to a Citrix Full Administrator account in your site. This account will be used to run health checks and analyse the site for updates. Click Add Site.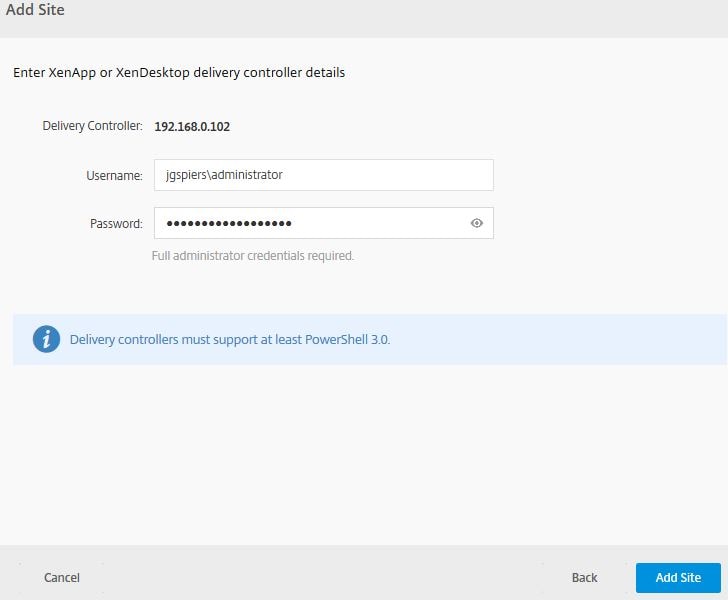
After a few moments the site will appear under Smart Check. The site will also be added to Smart Scale. Click on Get Started.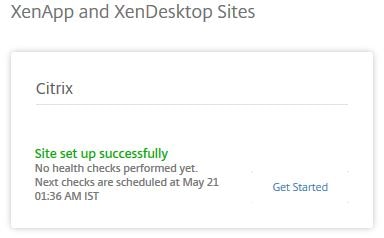
Shortly after adding a site to Smart Check, health checks will be performed.
Note: Make sure your Delivery Controllers are allowed to run PowerShell scripts.
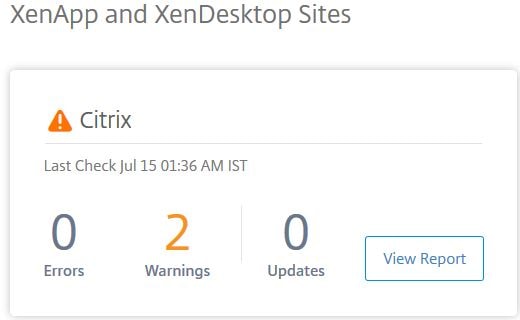
Once you navigate to a Site within Smart Check you’ll see if there are any outstanding warnings and when the next scheduled checks are due to commence. You can also View Reports, perform manual checks, configure the site and more. I’ll go through each section. For my site, 1 warning is outstanding. Click on the > arrow beside 3 Checks set performed for more information. 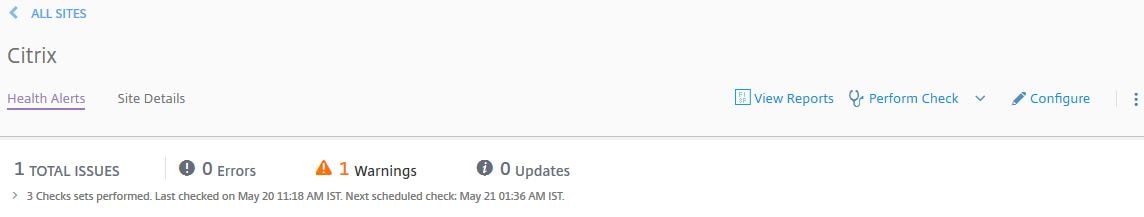
You can see that 3 different checks have ran, two completed without issue but the Site Health Checks found an issue.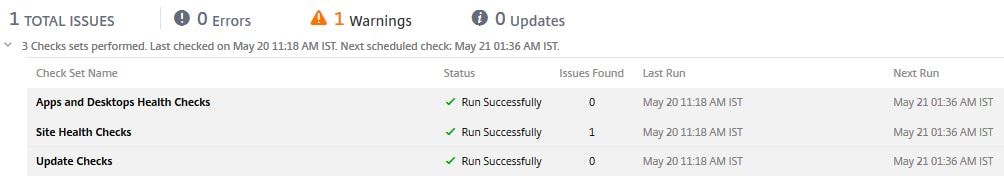
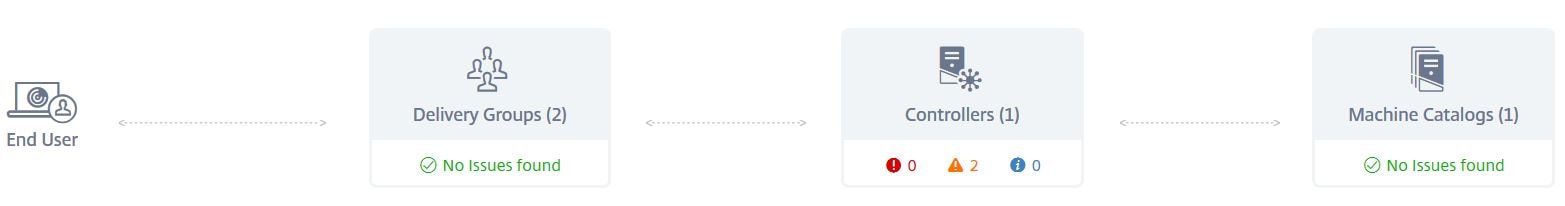
There will be a display of each component that checks have been run against, the Controllers, Machine Catalogs and Delivery Groups along with errors or warnings. As you can see my Controller has a warning. I can click on it to see what the warning is.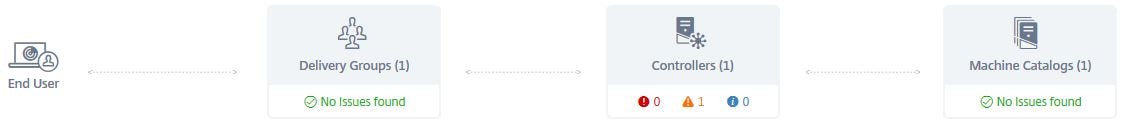
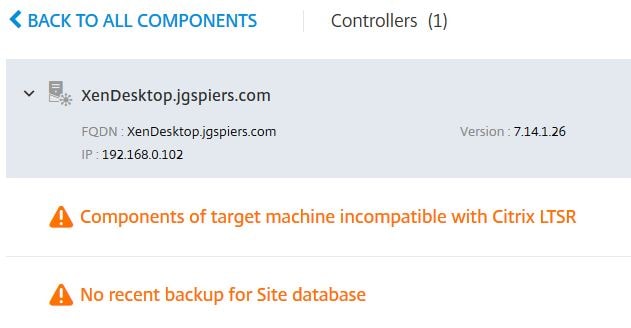
Upon exanding the Delivery Controller, the warning states that no recent backups have been taken of the Site database. Clicking on the right arrow beside the date and time the warning was found displays further information.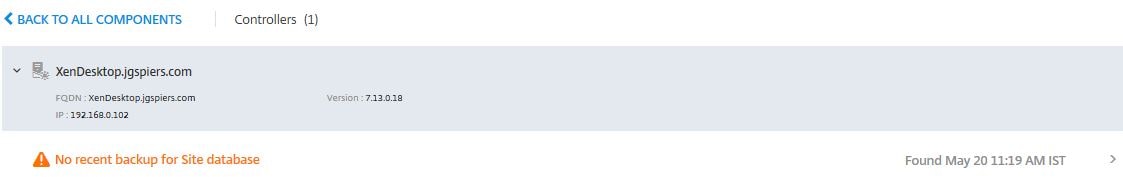
The alert displays more information including a recommended fix. 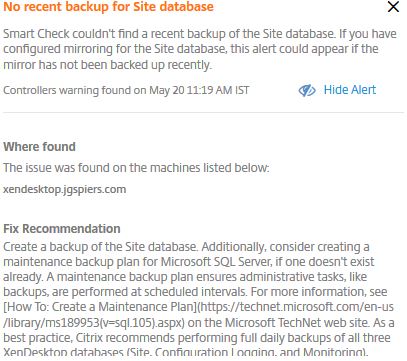
You will also be emailed when issues have been found from Health Checks.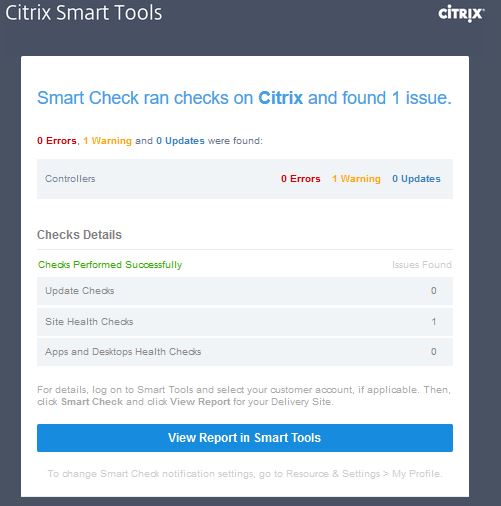
If you want to turn email notifications off, click Resource and Settings -> My Profile -> change Enabled to Disabled beside Smart Check issues summary. 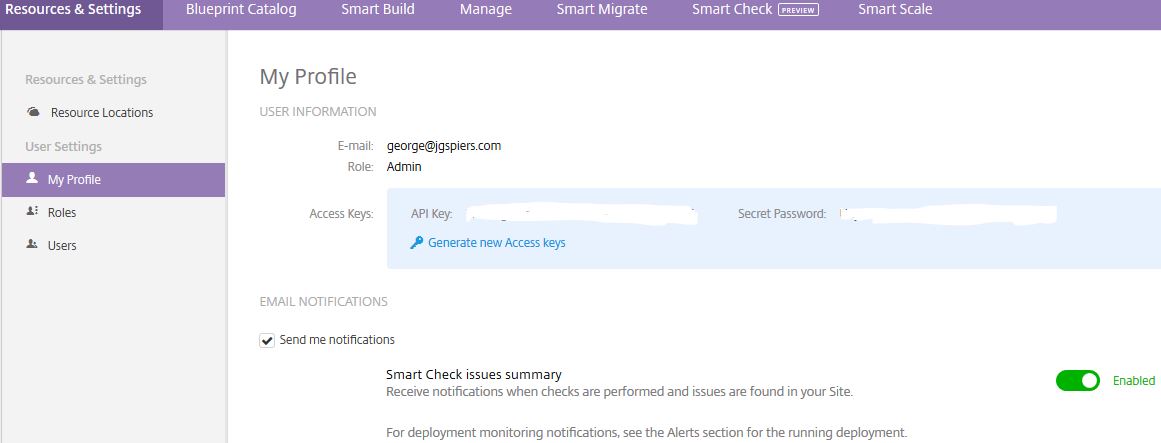
Update: Smart Check can now discover License Servers, PVS Servers and StoreFront servers and allows you to run custom created health checks against them.
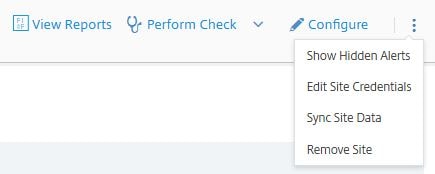
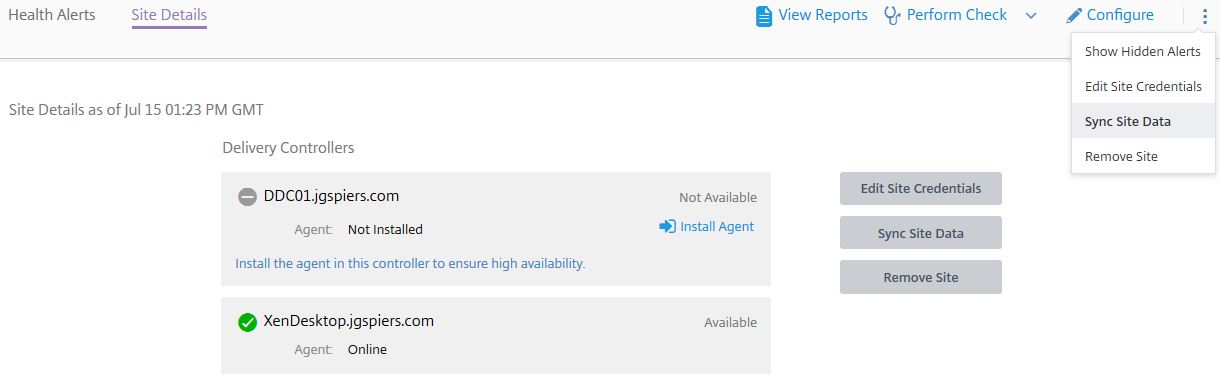
Back over in Smart Check, clicking on a site and then clicking on Site Details displays your Delivery Controllers and gives you the option to synchronise site data, remove the site or change the Full Administrator credentials. 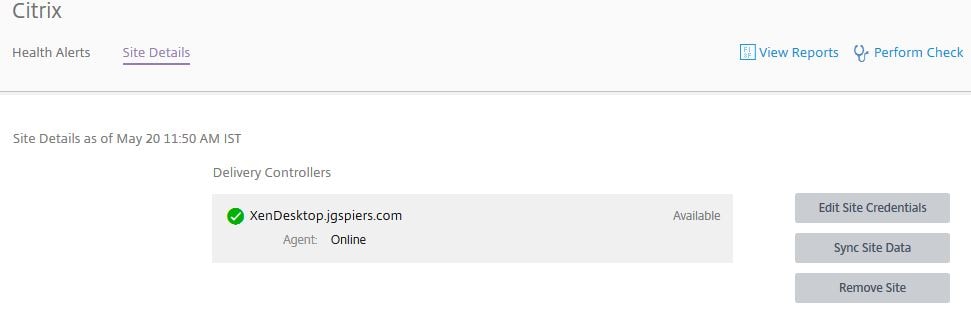
Those same options are available by clicking on the verticle ellipsis. The Sync Site Data option allows Smart Check to detects additional infrastructure that has recently been added to your site. Click on Edit Site Credentials.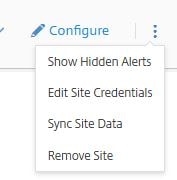
You can change credentials to another Full Administrator then click Done.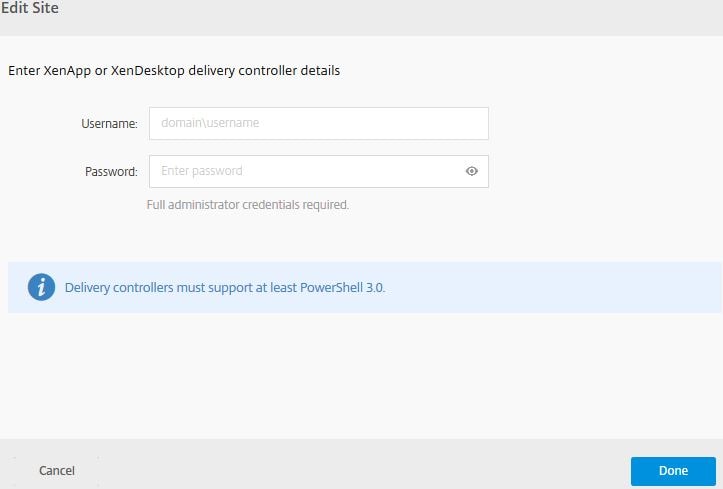
If you want to perform a manual health check, click Perform Check. You can perform individual checks or all using the Perform all Checks option. I’ve purposely powered off my VDA so I’ll click on Apps and Desktops Health Checks.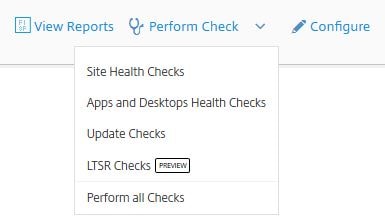
Click Perfom Checks Now. 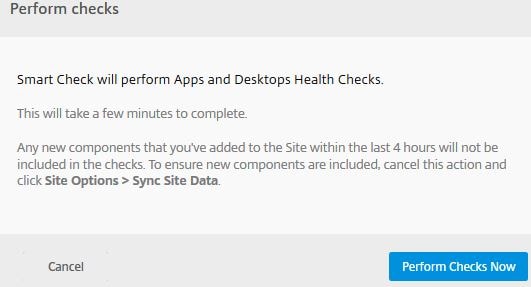
The appropriate checks begin to run. 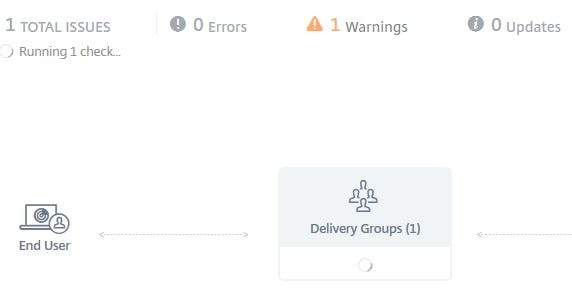
One error has been found on my Delivery Group. Click the Delivery Group.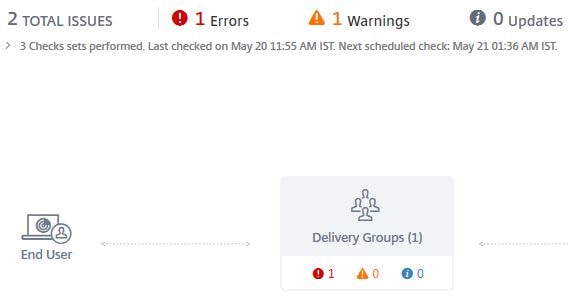
The error shows that there is 1 Unregistered VDA against the Delivery Group and that the Delivery Group is not able to serve connections. Click on the > arrow for more information. 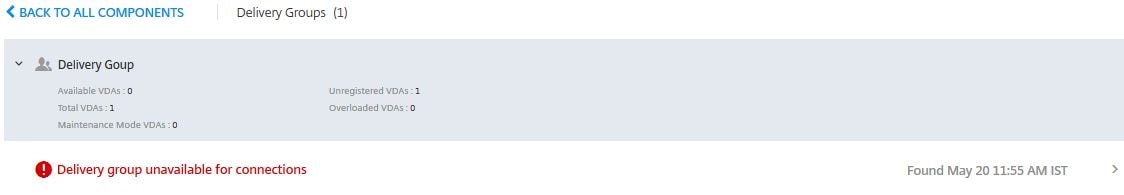
Here the additional information displays recommendations to fix and the time the error was found. If you want to hide the alert, click Hide Alert.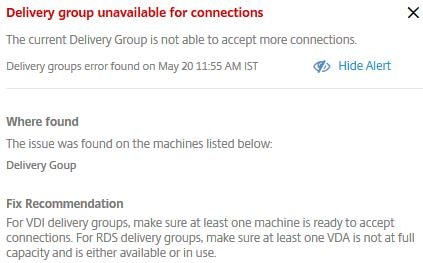
Click Hide Alert. Notice that it will not appear again until we restore the alert. 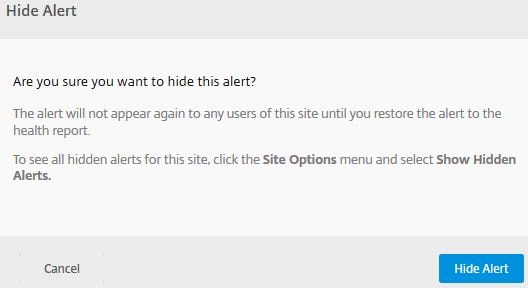
To restore the alert, click on the vertical ellipsis and select Show Hidden Alerts. 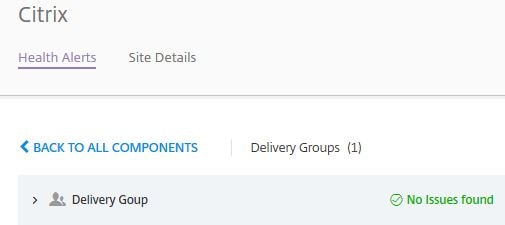
The alert will appear back against the Delivery Group, click the > arrow beside the error date and time found and then select Restore Alert.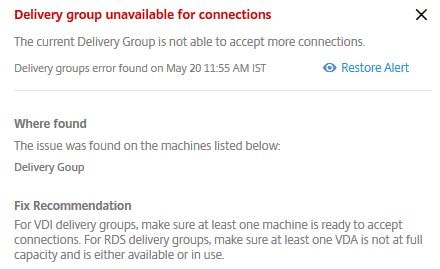
Smart Check Schedules:
If you want to change Health Check schedules or disable them, click on Configure. 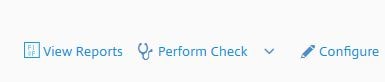
You’ll be given a list of the four checks possible. You can configure the health checks to run on a schedule (or not). By default all schedules apart from LTSR Checks run every day between 12AM and 5AM based on the Time Zone of the first Delivery Controller Smart Check discovers. You can choose to run the checks Every Day or Every Week.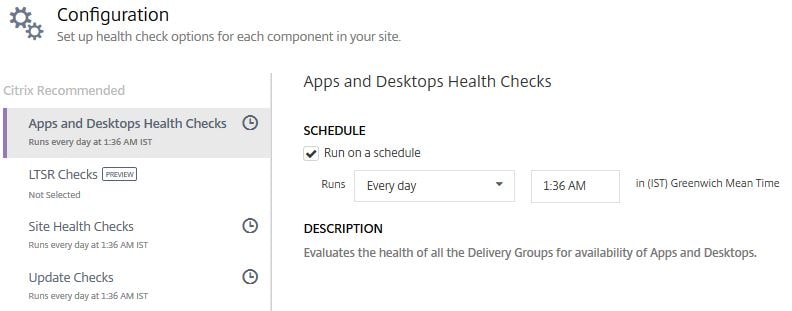
The LTSR Check is not scheduled to run. You can run the check manually. To the top-right, click Return to Health Report.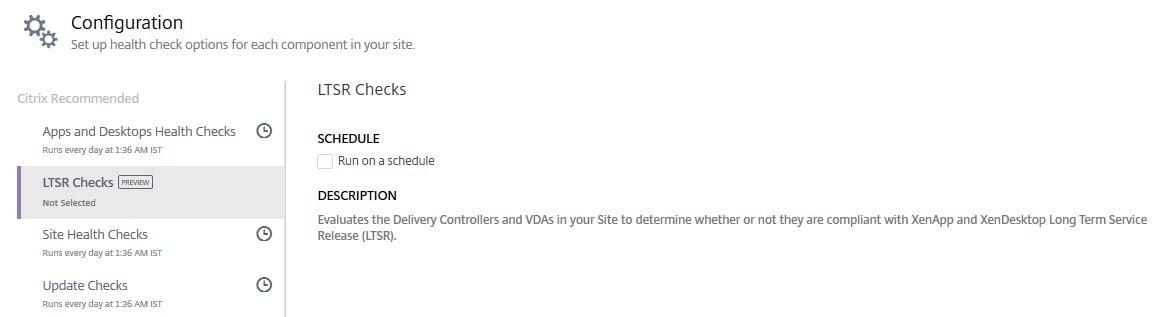
Click Perform Check -> LTSR Checks -> Perform Checks Now. 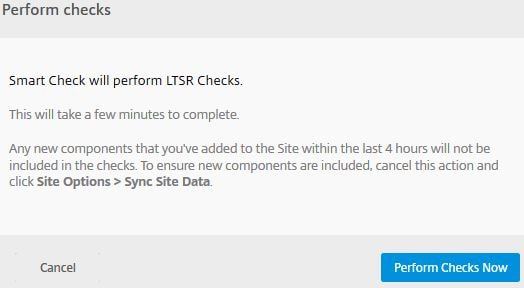
Once the LTSR check is complete, if your Site it not compliant, an issue will flag. 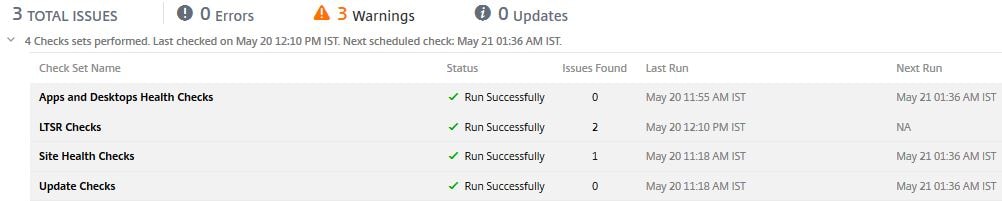
The issue found states that Components of target machine incompatible with Citrix LTSR. 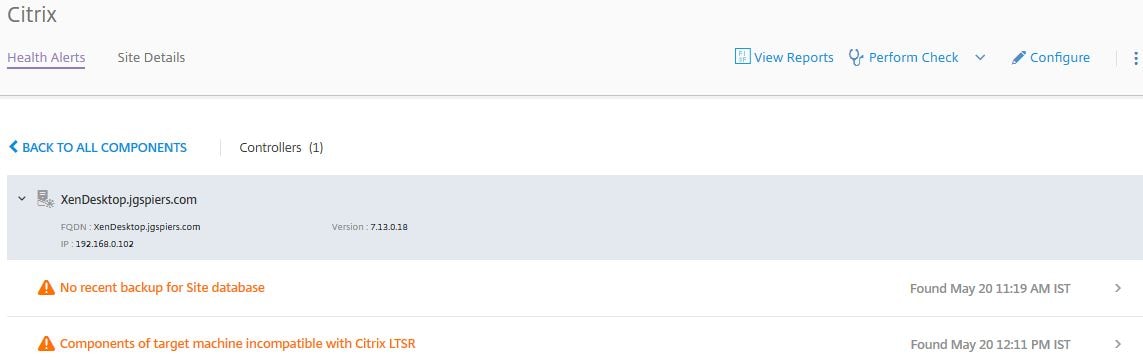
More information displays information on what to do. My XenDesktop site was running 7.13, so the site was not compatible with XenDesktop 7.6 LTSR (7.15 LTSR was not released at the time).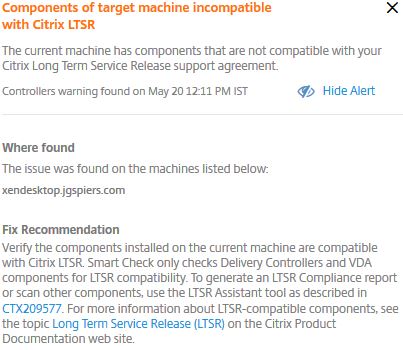
You can view a report of the LTSR check by clicking on View Reports. Click Download Report next to the LTSR report.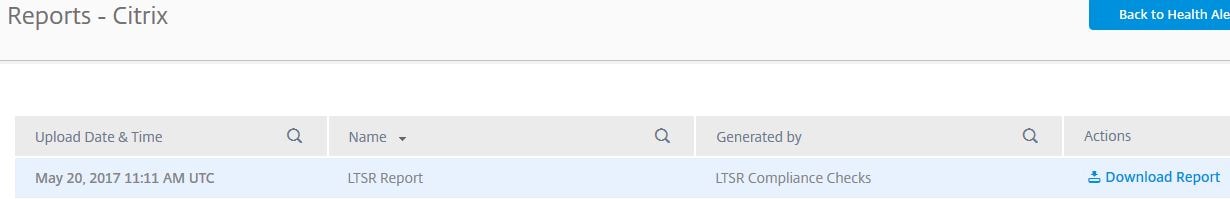
A number of different files will download in a packages folder. Most of them CSV. I’ll open a couple as examples.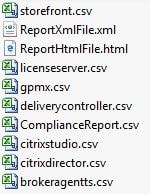
The licenseserver.csv report shows that my License Server version is newer than the required LTSR version. 
The same goes for the citrixdirector.csv report. 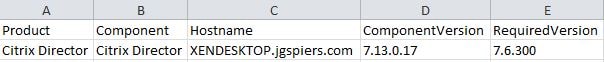
The ReportHtmlFile.html shows an overall report indicating that the site is not compliant with XenApp/XenDesktop 7.6 LTSR.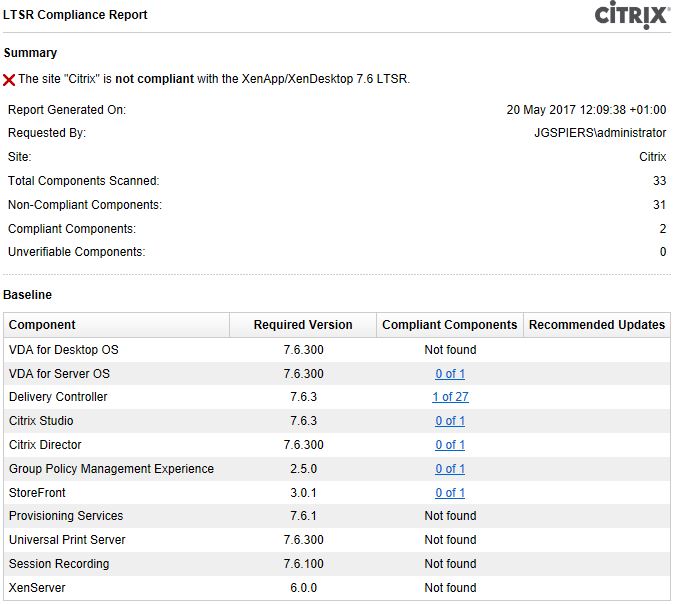
The ComplianceReport.csv file lists all components found in the site, their version and the version they should be for LTSR compliance. 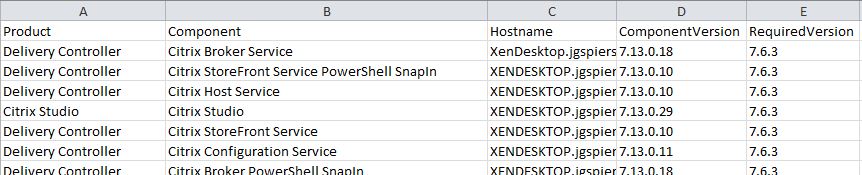
Upload Site diagnostics to CIS via Smart Check:
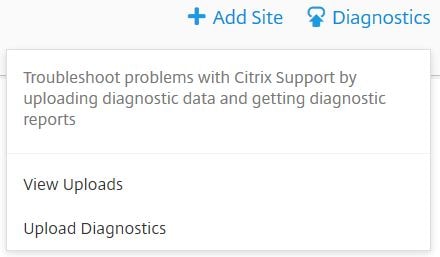
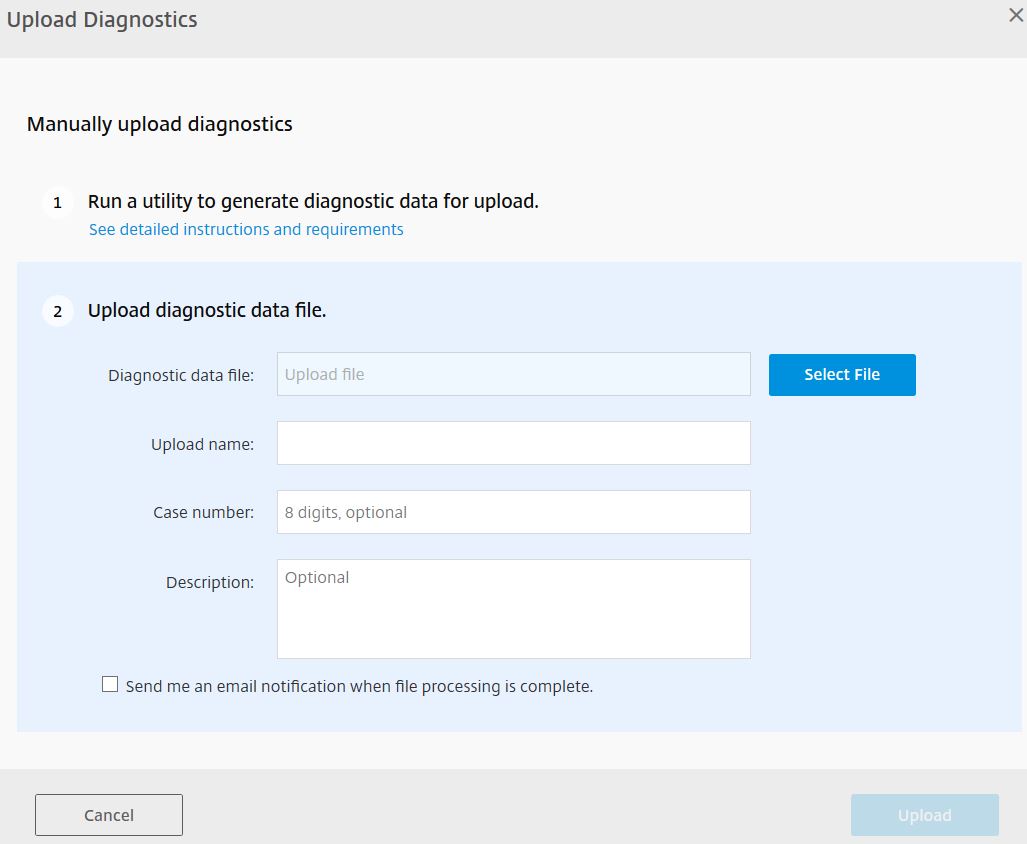
The Smart Check section of Smart Tools allows you to upload diagnostic files to Citrix Insight Services at the request of Citrix support. You can also copy and send Citrix support generated links to your support files. Click Diagnostics -> Upload Diagnostics.
Click Select File to upload a diagnostics file.
As the diagnostics file uploads you should not navigate away from this page.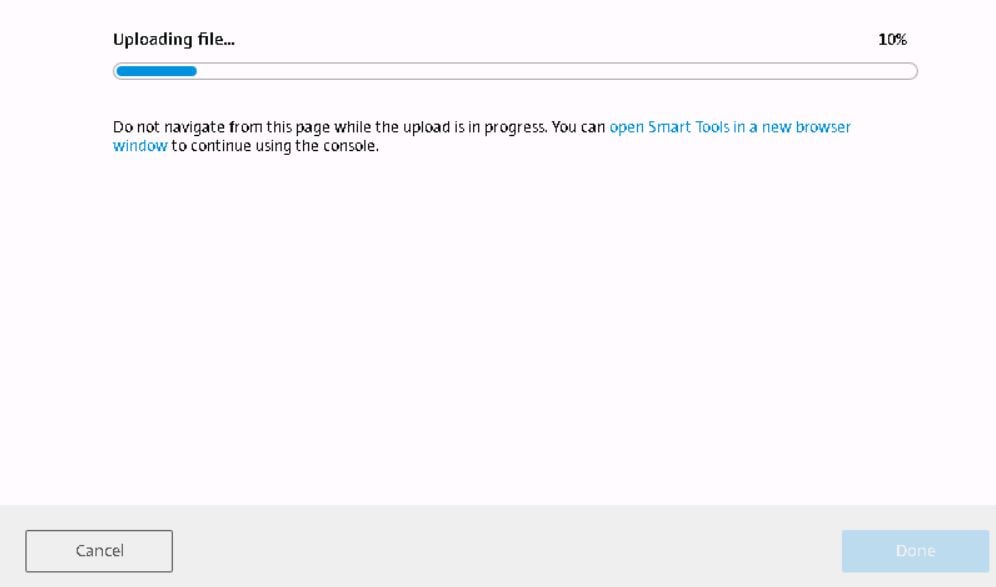
Click Done.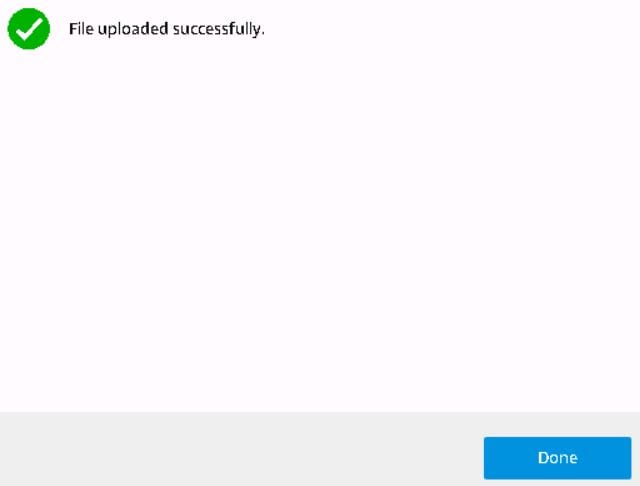
After the file has been uploaded it is analysed by CIS.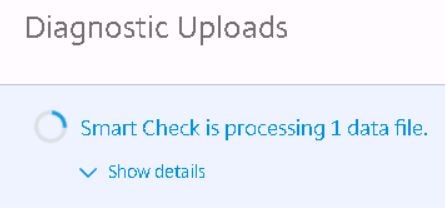
When analysis completes you’ll see some basic information about the file. Click on the > arrow to display more information.

You’ll be presented with slightly more information including a report link to share with Citrix support. Whilst you can upload any type of diagnostics file, Smart Check currently only supports running health checks on XenApp and XenDesktop.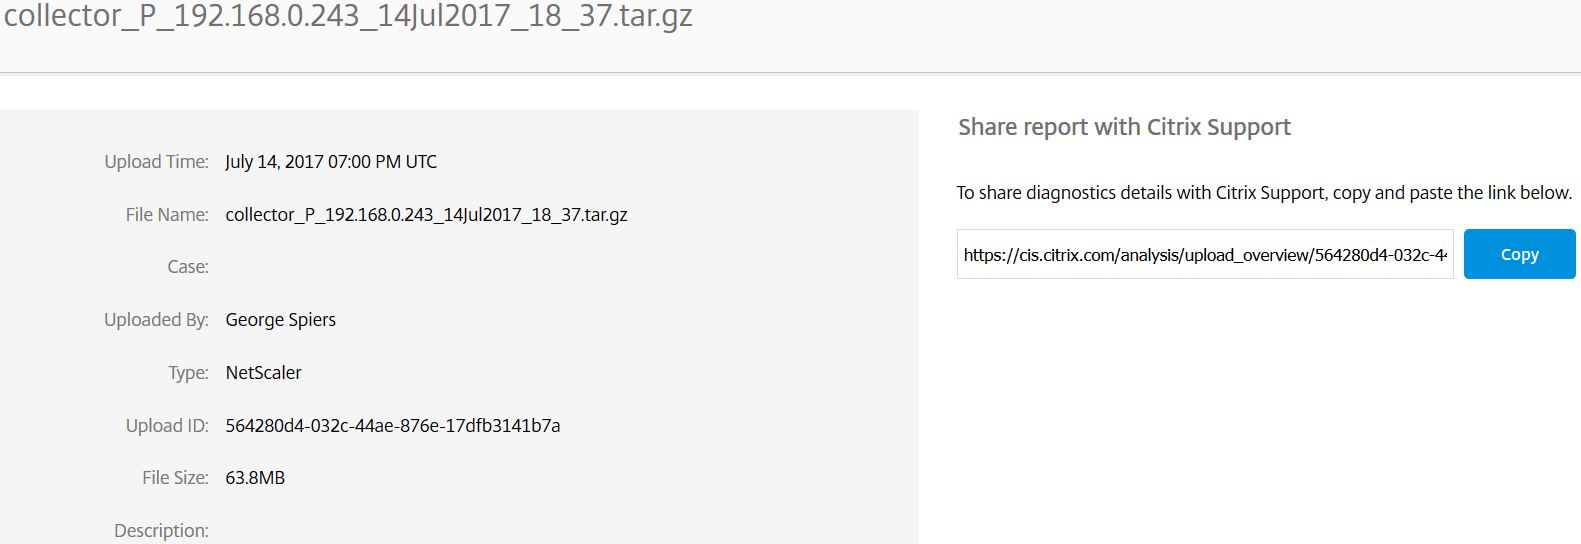
If you were to upload a XenApp or XenDesktop support file, the site if not already known to Smart Check will be added to Smart Check. You can then install the Smart Check site agent on Delivery Controllers in that site to allow health checks to be performed. If you remove a site from Smart Check, make sure the diagnostic data is also removed from Citrix Insight Services or else the site may be re-added to Smart Tools.
If you click View Report against any site added to Smart Check, you can get some site specific information such as the number of Delivery Groups, Controllers and Machine Catalogs in that site.
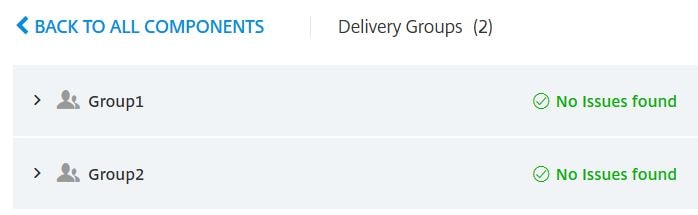
If you click further into the site components i.e. Delivery Groups, you are presented with the names of each group along with any known issues.
Here you can see both Delivery Group names.
Looking at the Delivery Controller of a particular site displays the product version, name of the DDC and any outstanding alerts.
Install Smart Tools Site Agent on multiple Delivery Controllers:
As mentioned before it is advisable to install the agent on multiple Delivery Controllers for high availability. After you have added your site to Smart Check, if you click on Site Details the Delivery Controller which already has an installed agent displays along with any other discovered Delivery Controllers. You have the option of installing the agent on additional Delivery Controllers from this portal.
Remove Site from Smart Check:
To remove a Site click View Report on the site of your choice, now either click the verticle elipsis -> Remove Site or click Site Details -> Remove Site.
Click Remove.
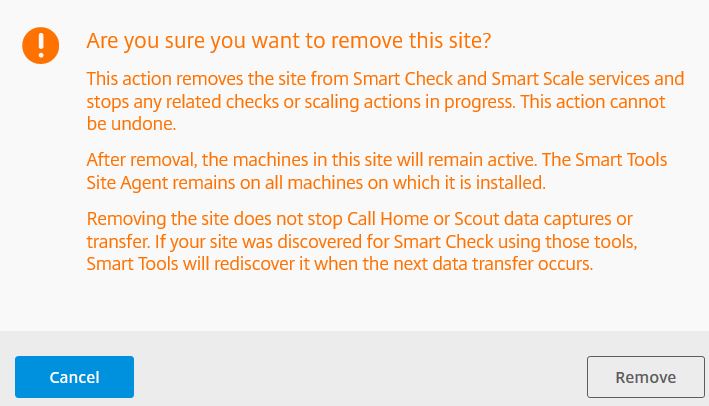
You can also remove the Site Agent which unregisters the site from Smart Tools. If the unregister operation is not possible due to communication issues with Citrix Cloud then use the above Remove Site method.![]()
Smart Check Log Files:
Smart Check checks output log files in the following locations:
- Site Health Check log files are stored on your Delivery Controller(s) in C:\Program Files (x86)\Citrix\LifecycleManagement\proc\xdsitescout-<timestamp>. Log files are deleted after 5 days.
- Update Check log files are stored on your Delivery Controller(s) in C:\Program Files (x86)\Citrix\LifecycleManagement\proc\xdscout-<timestamp>. Log files are deleted after 5 days.
- Apps and Desktops Health Check log files are stored on your Delivery Controller(s) in C:\Program Files (x86)\Citrix\LifecycleManagement\proc\xaxdscout-<timestamp>. Log files are deleted after 5 days.
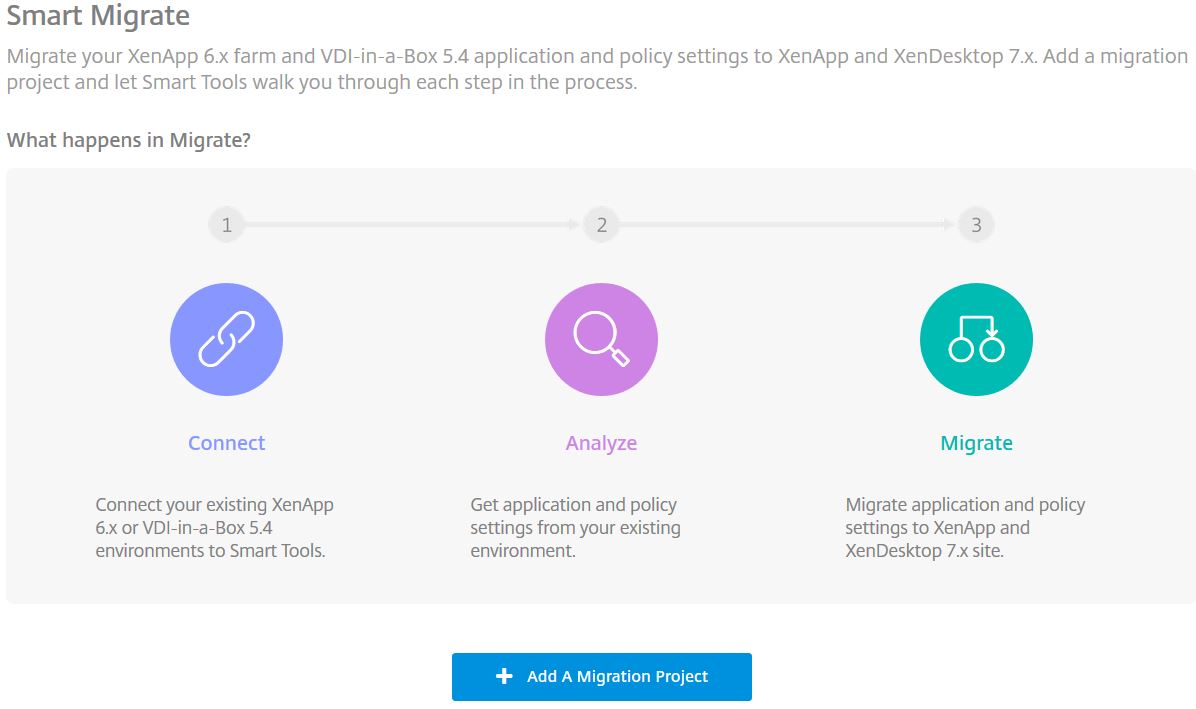
Citrix Smart Migrate (deprecated):
Citrix Smart Migrate can assist you in migrating XenApp 6/6.5 to XenApp/XenDesktop 7.x. You used to be able to migrate VDI-in-a-Box 5.4 to XenApp/XenDesktop 7.x but this ability was removed August 2017. For XenApp 6.x migrations Smart Migrate helps by exporting existing farm policies and settings and imports them to your new 7.x site.
You can migrate using an automated fashion by installing the Site Agent on one 6.x and 7.x controller, installing the XenApp 6.5 PowerShell SDK on all 7.x controllers or manually by runnnig migration scripts and uploading policies and settings to Citrix Tools for migration.
For more information see https://manage-docs.citrix.com/hc/en-us/articles/212714903-Prepare-to-migrate-your-XenApp-6-x-or-VDI-in-a-Box-5-4-deployment
To kick off a deployement, in Smart Tools click on Smart Migrate and then Add a Migration Project.
Using the drop-down select the migration you wish to perform.
Note: Ability to migrate VDI-in-a-Box 5.4 was removed in August 2017.
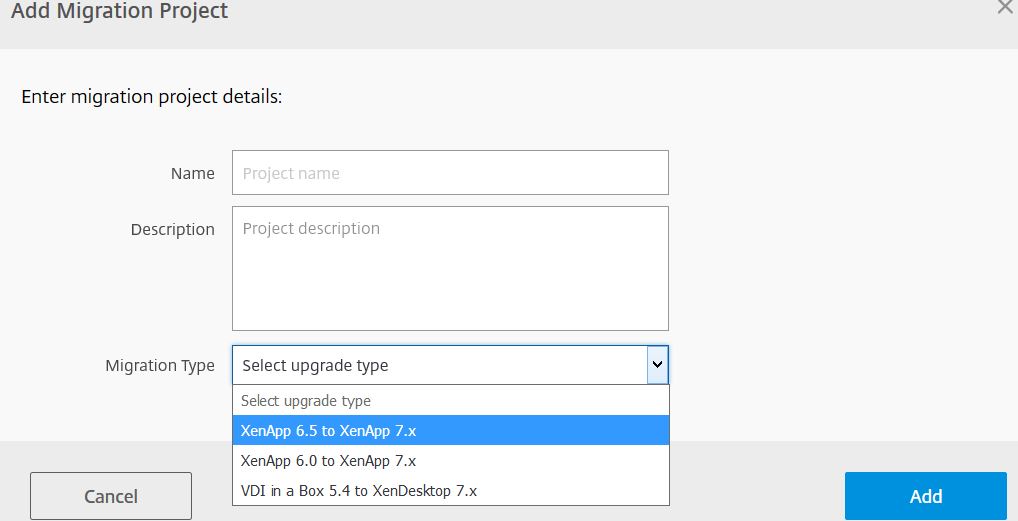
Upon selecting the migration type (in this case XenApp 6.5 to 7.x) you’ll be presented with some pre-requisite checks so make sure you have completed them before continuing. Click Add.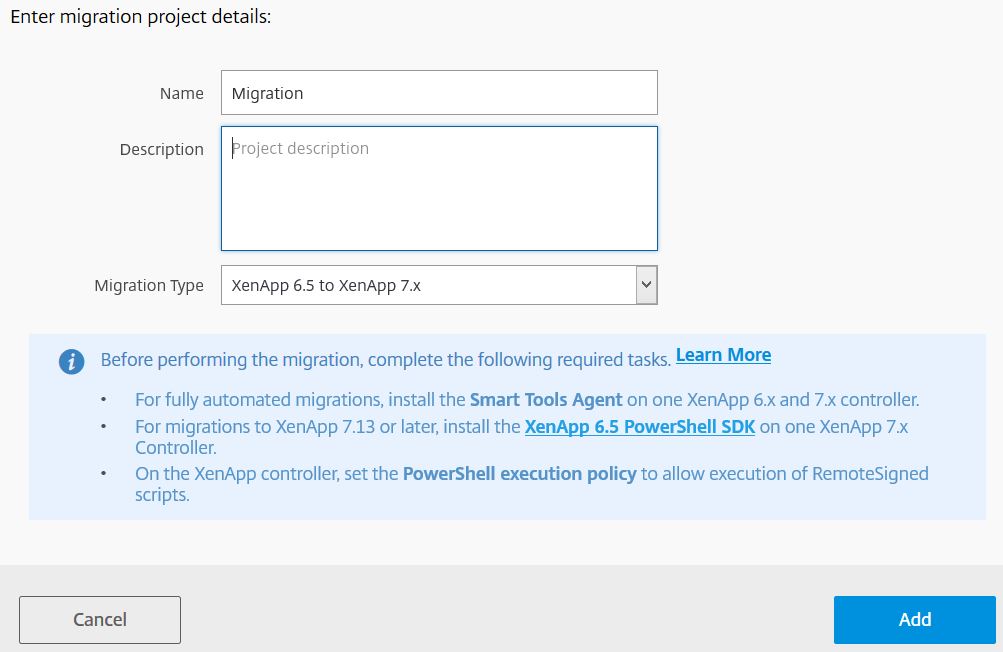
Select Fully Automated: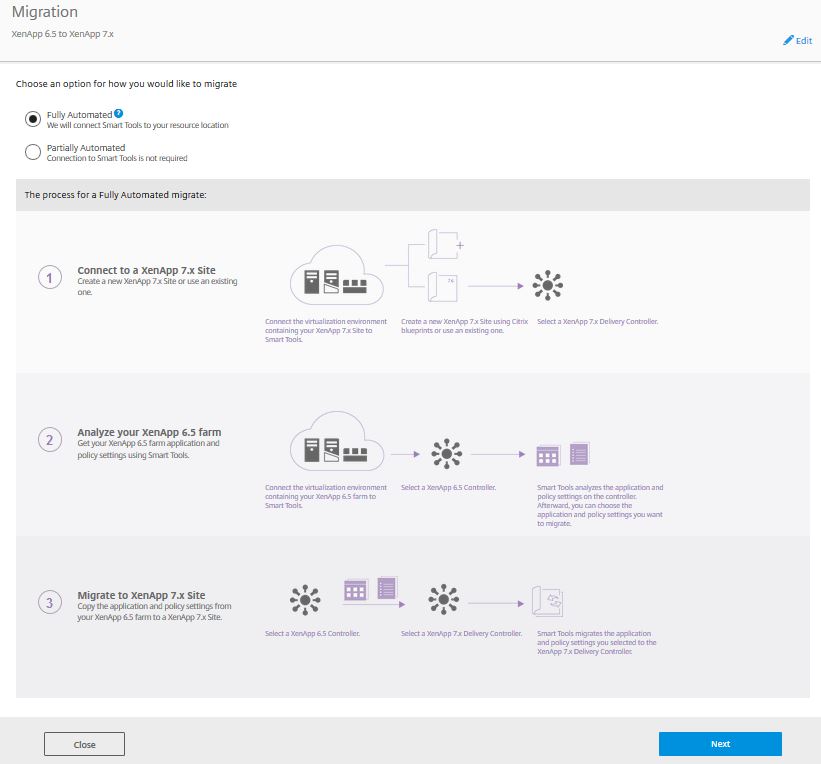
or Partially Automated: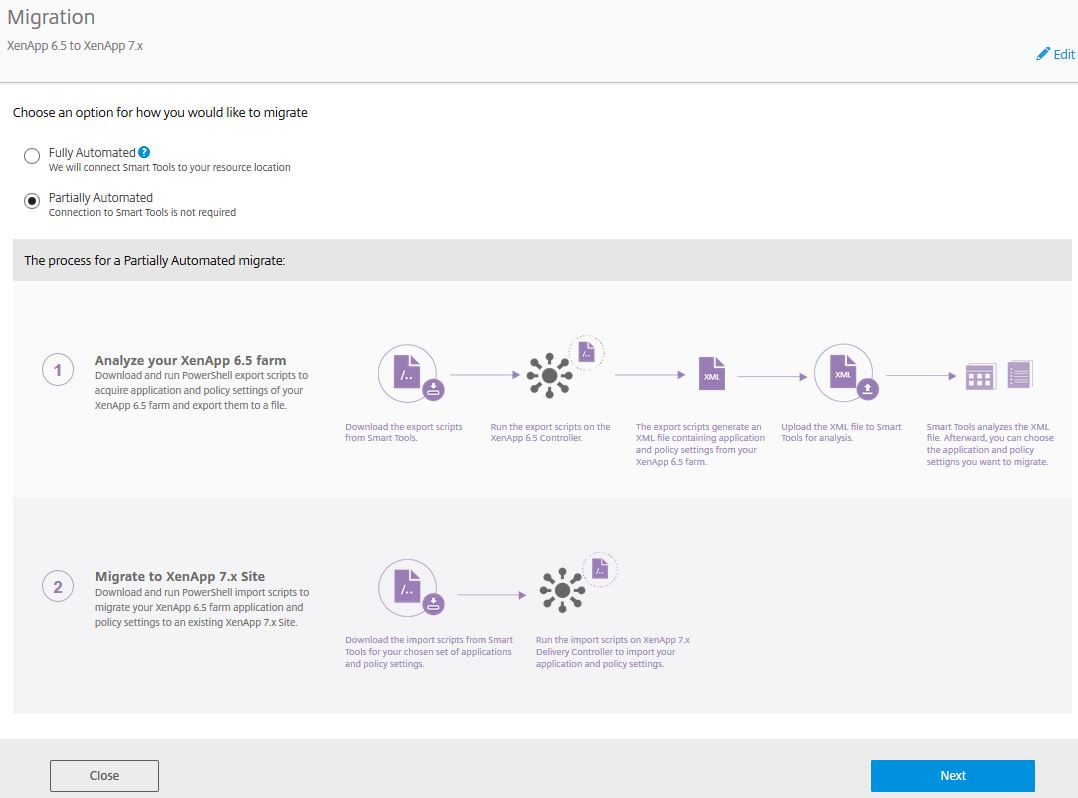
If you select Fully Automated you’ll be asked to select your XenApp 6.5 environment and controller. The 6.5 farm should be added to Smart Tools. You can choose to connect an existing deployment at this stage.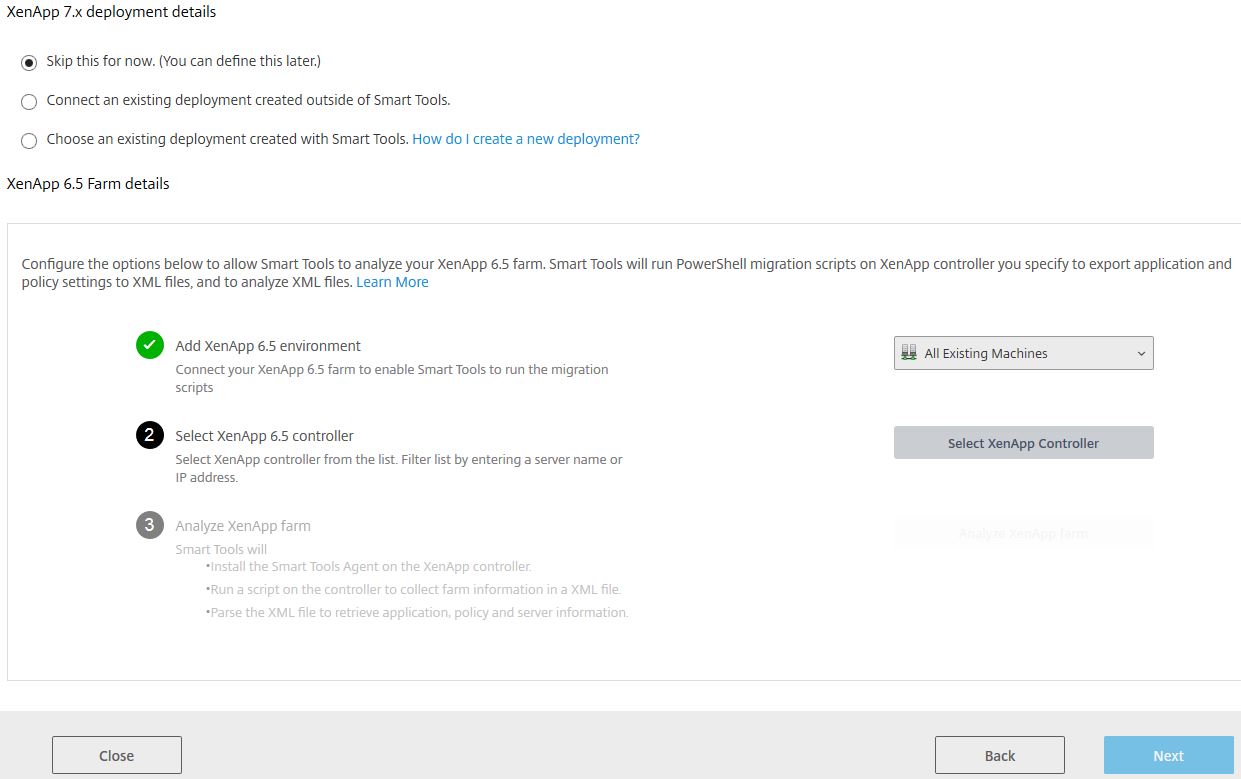
If you chose Partially Automated you’ll be tasked with downloading the scripts, running them manually, collecting policies and settings related to your XenApp 6.5 farm and then uploading them back to Smart Tools.
XenApp 6.x Migration Tool:
The XenApp 6.x Migration Tool is a collection of PowerShell scripts designed to migrate policy and farm data from XenApp 6.0 or 6.5 farms to 7.x.
You firstly run the scripts on a 6.0 or 6.5 controller, and then run import cmdlets on a XenApp 7.x controller. This tool will continue to be available after Smart Migrate has been discontinued.
For more information see: https://docs.citrix.com/en-us/xenapp-and-xendesktop/7-15-ltsr/upgrade-migrate/xenapp-worker-upgrade.html
Citrix Smart Scale:
Smart Scale is designed particularly to scale up and down Citrix VDAs per schedule and power manage them to save on the costs of running workloads on public clouds such as Azure or AWS. The amount of VDAs running in a Delivery Group monitored by Smart Scale can be based on session demand of Load Index value. Alternatively you can specify how many VDAs minimum you want running at any given time of the day to ensure adequate availability of resources for your user base.
Smart Scale requirements:
- Smart Scale is supported on Amazon EC2, Azure Resource Manager and Classic, and Citrix XenServer 6.2, 6.5, 7.0.
- You must configure hosting in XenApp or XenDesktop for Smart Scale to work.
- Your Site Delivery Controller(s) must support atleast PowerShell 3.0.
- Smart Scale supports XenApp, XenDesktop, XenApp and XenDesktop Service, XenApp Essentials and XenDesktop Essentials. Up to 2,000 VDAs per Site can be power managed (1,000 per Delivery Group) and up to 120 Delivery Groups can be power managed per Site. Monitoring data collection is supported for up to 5,000 VDAs per Site.
- Smart Scale supports pooled and static persistent VDI desktops but this is currently in “preview” and best to be trialled in testing environments whilst Server OS is fully supported. You should disable any power management functionality within XenDesktop to avoid conflicts with Smart Scale. When using VDI desktops, Load and Load/Schedule based scaling is not supported. When using schedule based only scaling, it is supported but Citrix recommend you use Smart Scale only during times where users log on to machines that are already powered on such as during business hours. When outside of business ours where machies are likely to be powered off, do not use Smart Scale but instead use the XenDesktop built-in power management capabilities. Also with random desktops which power off each time a user logs on, Smart Scale may attempt to power off the machine as well and eventually display an error on the Events and Machine Activity pages.
As the front tile says, “Keep costs of your cloud based deployments under control with usage and schedule based scaling”.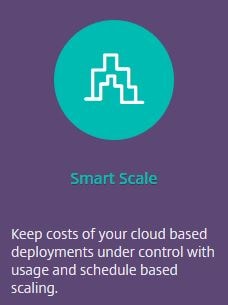
To access Smart Scale, launch Smart Tools and click the Smart Scale tile.
Add Site to Smart Scale:
Any sites you have already added to Smart Tools via Smart Build (agent must be deployed as part of blueprint) or Smart Check will be displayed, including any site with a Site Agent installed on one or more of the Delivery Controllers. XenApp and XenDesktop Service sites do not need added as scaling is directly actioned through the XenApp and XenDesktop Service. If you need to add a site manually, you can always click Add Site. This will allow you to install the Smart Tools Site Agent to one of your Delivery Controllers. The process has been described under Smart Check.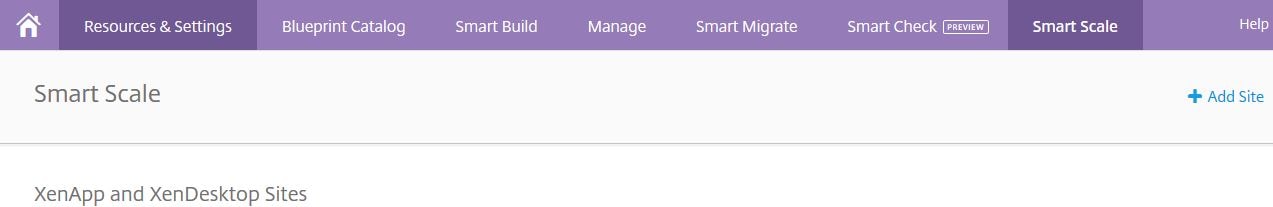
Once your site is added it displays under Smart Scale. Click Get Started. 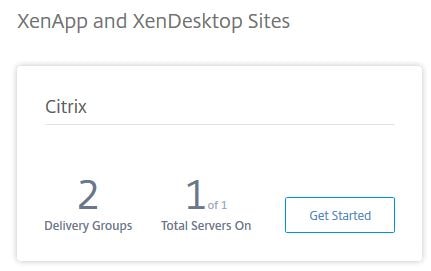
The main page displays each Delivery Group to the left and Delivery Group specific data along the middle pane. Here you can see estimated savings calculated based on the machine running cost per hour. Say for example you have an Azure subscription and run VDAs on machines that cost $1 per hour. If you tell Smart Scale the price, an estimated savings value is calculated based on the amount of time Smart Scale is able to keep a VM powered off. This is the benefit of Smart Scale as it power manages machines when they are not used rather than have all VDAs running at the same time incurring cost. This is quite like the on-premise Power Management capabilities of XenDesktop so nothing new.
In this screen you also have the total amount of VDAs in a Delivery Group, how many sessions are running, how many VDAs are powered on and so on. You also have four tabs below the site name. Smart Scale by default will be disabled on all Delivery Groups so it is up to you to enable on the Delivery Groups of your choice. To enable Smart Scale against a Delivery Group, select a Delivery Group to the left and click Configure.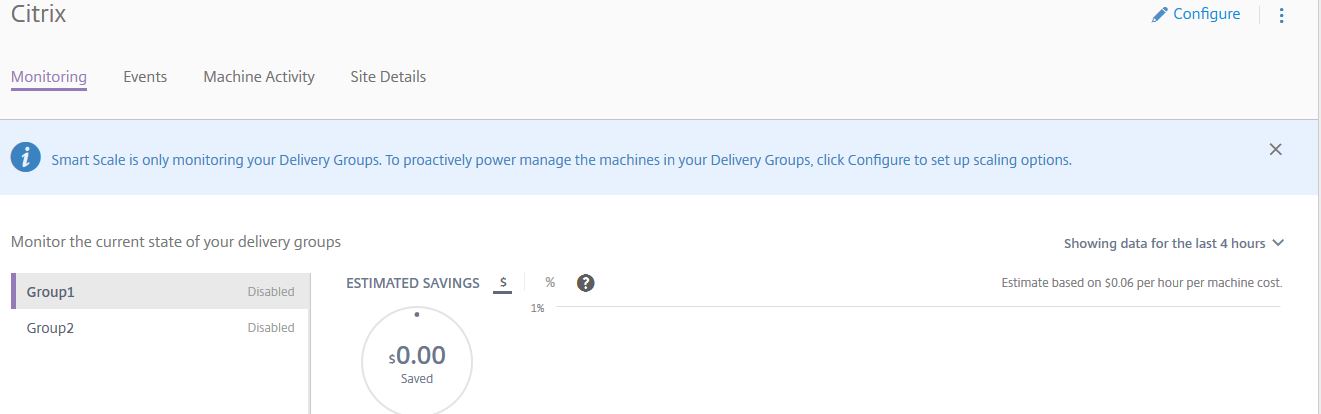
There is a toggle switch to the right, beside Scaling Disabled. Click the toggle. 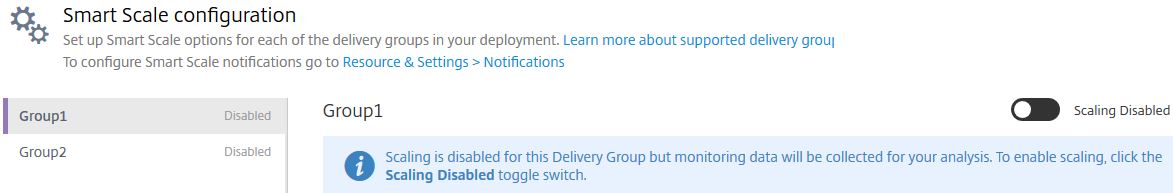
The text will change to Scaling Enabled. Scroll down.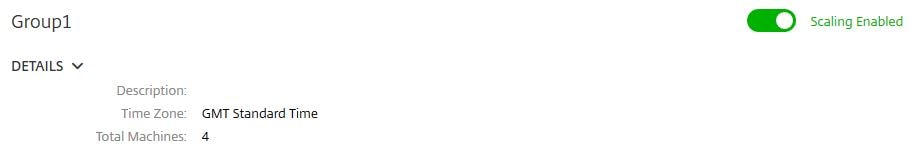
Here you can configure capacity management for the Delivery Group.
Using Smart Scale you can control load as follows:
- Load-based and schedule-based scaling – Create schedules and define how many VDAs you want to be powered on at that time and scale VDAs up or down based on session demand.
- Schedule-based scaling only – Create schedules (blocks of time) and define how many VDAs you want to be powered on at that time.
- Load-based scaling only – Based on Session Count or Load Index of the VDAs, scale up or down VDAs to meet demand. Keep in mind that a Delivery Group monitored by Smart Scale must have enough VDAs to meet demand. Smart Scale does not automatically provision and add extra VDAs to Delivery Groups.
By default Load-based and schedule-based scaling is selected with 1 Max session per host. Click the Advanced button.
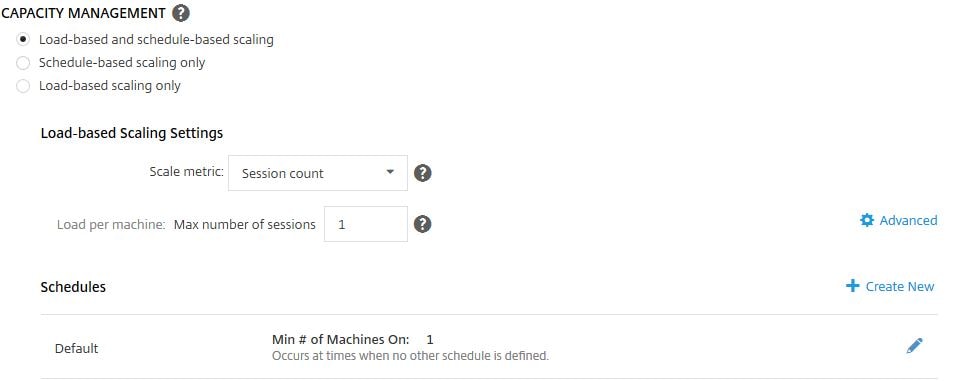
Here you can adjust the capacity buffer which is by default at 10%. What this means is that if for example you have 20 VDAs in total with 10 users connected on a 1 to 1 basis, an 11th VDA will be powered on (assuming it is not already powered on) to be able to host an 11th session. If you had set the Capacity Buffer to 50%, 15 VDAs should be powered on as 50% of 10 sessions = 5. It is up to you to make sure the Delivery Group has enough VDAs to host session demand. If 100 user sessions are connected, VDA capacity is scaled to support 110 sessions. Power Off Delay is a newer option and specifies if machines should be powered off only after the initial delay has lapsed. Click OK.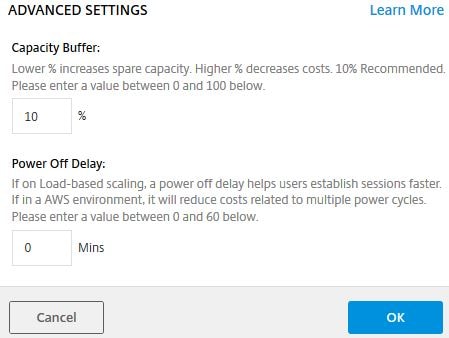
You can also set the Scale metric to Load Index, the default value is 10000 and cannot be changed. Load Index is only applicable to Server OS. If the Load Index value is reached, VDAs are power managed appropriately. To read up on Load Index see https://jgspiers.com/vda-load-index-xenapp-session-load-balancing/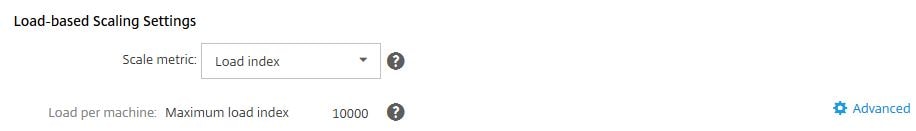
Create Smart Scale schedules and load scaling:
You also have the option of creating new schedules, which dictates the amount of VDAs minimum that should run at any given time. The Default schedule is used at times where a custom schedule is not active, so one VDA will be powered on during this time. The time is based on local time of your Delivery Controller(s). You can also enter the machine cost for estimated savings. By default this value is 0.06. Beside Schedules, click Create New.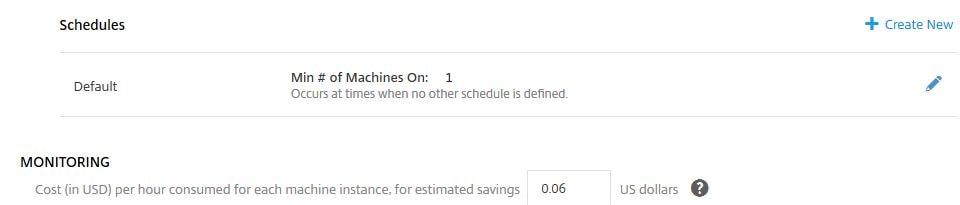
Enter a name, a value for how many machines you want to run and when you want to run them. My Delivery Group has 4 VDAs, so I am telling Smart Scale that I want 2 VDAs to be powered on every day between 8AM and 9PM. Outside of these times the Default Schedule will keep just one VDA online and scale based on demand which is optional. You can instead specify a % of machines that must be powered on during the schedule. For example, 10% of 10 machines is 1 VDA and 10% of 100 VMs is 10 VDAs. As Delivery Groups scale up or down, Smart Scale follows and keeps the correct percentage of machines powered on. Click Create.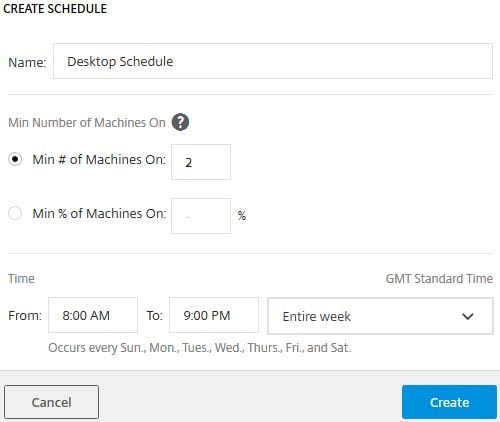
The new schedule shows as below. You can create multiple schedules but they cannot conflict with one another.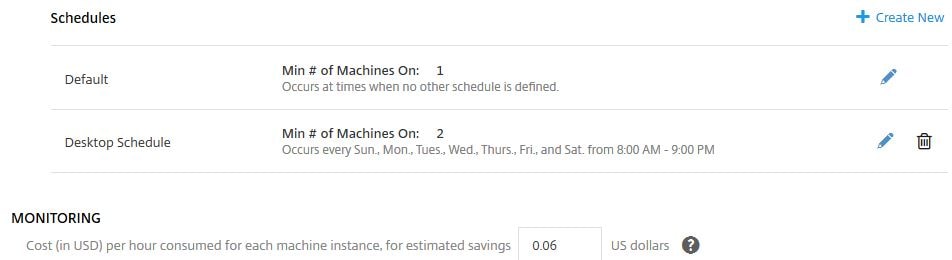
As a test I will set my Capacity Buffer to 50%. 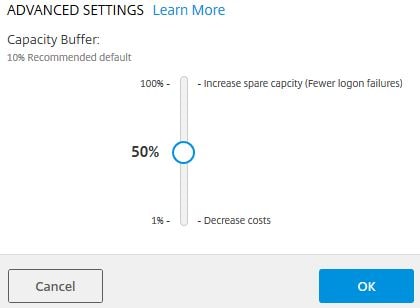
I will also keep the Session Count at a maximum of 1 session per host. 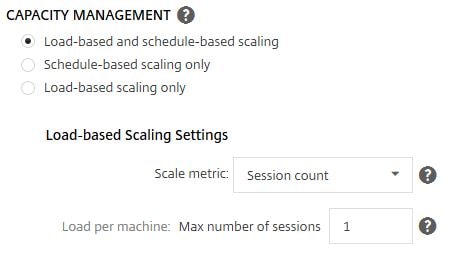
Click Return to Site Monitoring. 
To recap, my Delivery Group has 4 VDAs in total. I have restricted each VDA to only launch a maximum of 1 session and told Smart Scale to keep a minimum of 2 VDAs powered on during 8AM-9PM every day. I have also set the Capacity Buffer to 50% so that when a second session is launched a third VDA is powered on. To show this working, click on Machine Activity. Here you see two VDAs have been powered on to meet my schedule demands. The Machine Activity tab shows which machines have been powered on/off and been placed into maintenance mode.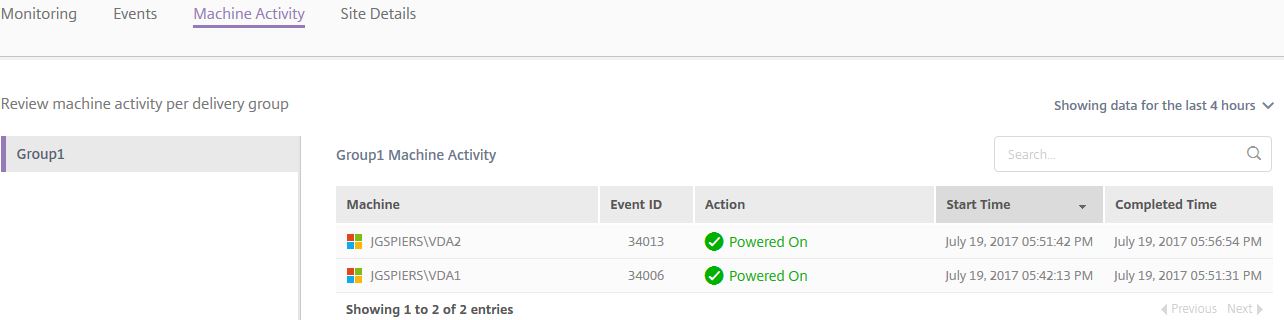
If you click on the Events tab you will see similar information. 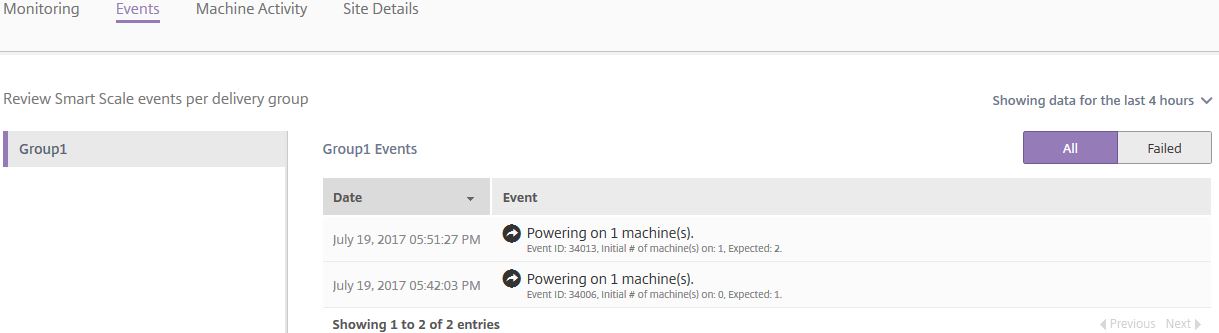
You can change the time range up to a month. The Machine Activity tab allows you to do the same. 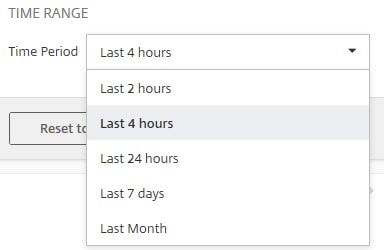
Two sessions have now been launched against VDA2 and VDA4. 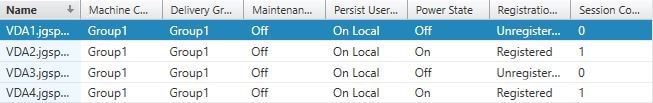
Shortly after VDA1 is powered on, as the previous two sessions triggered the Capacity Buffer. 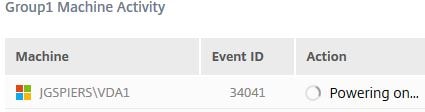
As a third session connects to VDA1 and then logs off, VDA1 is placed in Maintenance Mode to prevent anyone else connecting and it is then powered off. Smart Scale selects the VDA with fewest sessions and places in maintenance mode. Once the machine has drained of sessions it is powered off. At this stage if the VDA was hosted in the public cloud we would be saving money.
Note: To ensure machines are adequately drained, create idle and disconnected session policies.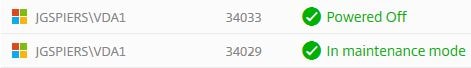
The Site Details tab shows brief information about your site Delivery Groups and Delivery Controller(s) including status as indicated by the green tick. You can force a site data sync, remove the site from Smart Scale or edit the Site Credentials.
Note: Site Credentials must be of an account that is a member of atleast the Delivery Group Administrator role in Citrix Studio and part of the Domain Users group. This account is used to impersonate the Site administrator and execute monitoring and scaling actions.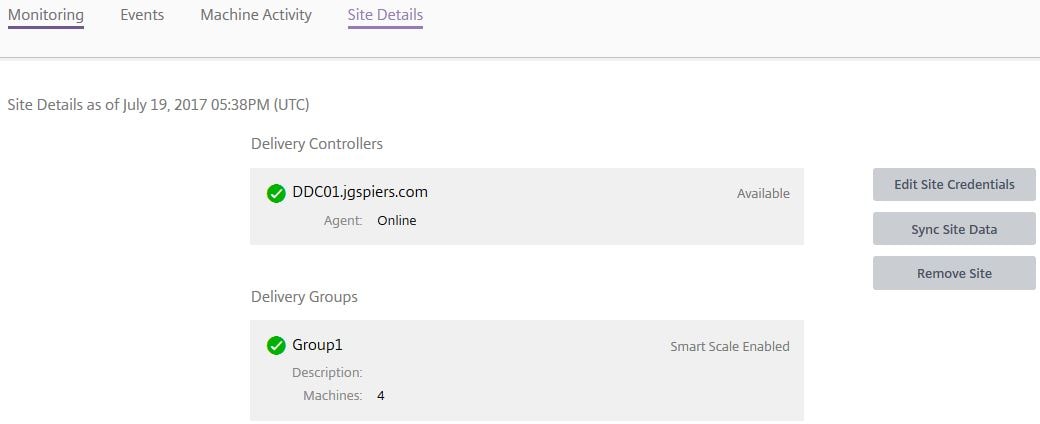
Using the verticle elipsis you can perform the same actions including turning off Smart Scale for a site. Smart Tools can automatically turn off Smart Scale on your Site if none of your Delivery Groups are configured for power management through Smart Scale or no Smart Scale events such as powering on or off have been generated in the last 30 days. 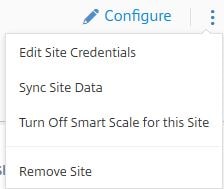
Smart Scale monitoring data is collected every 5 minutes for a Delivery Group when you enable Smart Scale for that Delivery Group. There may be a slight intial delay in displaying monitoring data when you first add a Site to Smart Scale. If Smart Scale is later disabled, no new monitoring data is captured but you can still view previously collected monitoring data.
Enable or Disable Smart Scale error event notifications:
Browse to Resources & Settings -> Notifications and enable/disable Smart Scale error events.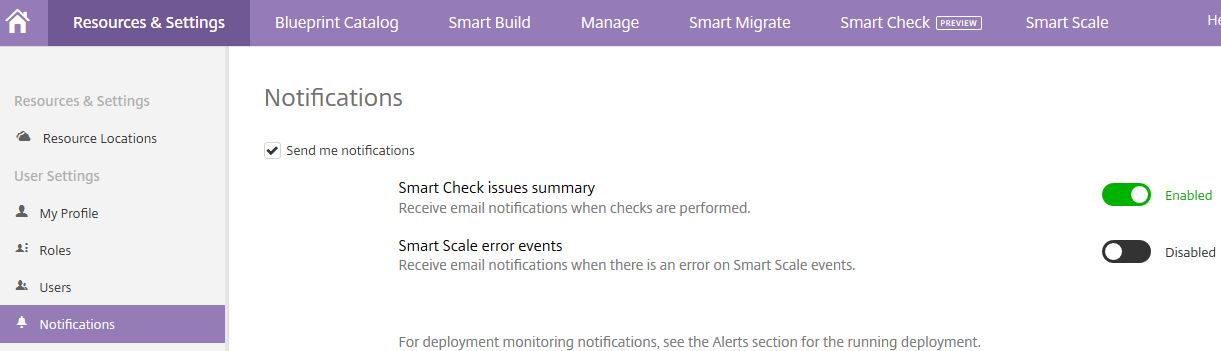
Remove Site from Smart Scale:
To remove a Site from Smart Scale you can either uninstall the Smart Tools Site agent from your Delivery Controller(s) which unregisters the Site completely from Smart Tools, or you can remove the Site from Smart Scale which also removes the Site from Smart Check but keeps the agent installed on your Delivery Controller(s).
Note: XenApp and XenDesktop Service sites cannot currently be removed from Smart Scale. It is recommended to just disable Smart Scale if you do not want to use it.
To do this click on the Site you want to remove and click Site Details -> Remove Site.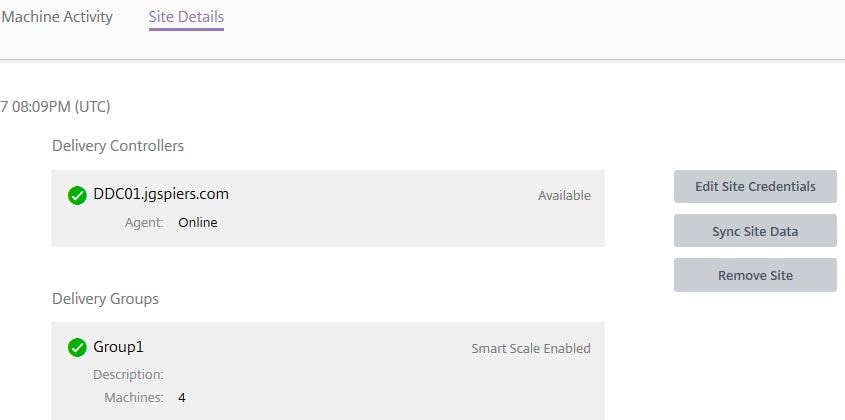
Click Remove. 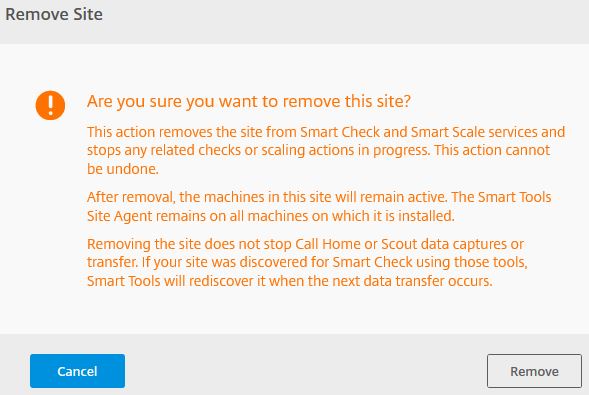
Troubleshoot Smart Scale events:
For a list of events and troubleshooting tips see https://manage-docs.citrix.com/hc/en-us/articles/115002373886-Troubleshoot-Smart-Scale-events
Pingback: EUC Weekly Digest – July 22, 2017 – Carl Stalhood
Ray
August 24, 2017I am just getting started with this, Any Idea why StoreFront, PVS , and Licesening states perform Check to discover, But when I do nothing happens?
George Spiers
August 24, 2017Right now you can only use custom created checks against these components to discover them. Citrix cannot discover them by default. To create custom checks see https://manage-docs.citrix.com/hc/en-us/articles/115001578043-Use-custom-checks-and-alerts-with-Smart-Check#custom-checks
Ray
August 25, 2017Ahh, Ok Thanks man. I appreciate the help.
Dim
October 20, 2017Hello George, I think the first line in the file “unattend.xml.” is not complete:
language = “neutral” versionScope = “nonSxS”
Could you please check, update
Thank you
Dim
George Spiers
October 20, 2017Hi Dim. This is just an example unattend file. You should configure your own to your needs, which will be different.
John Carmody
July 31, 2018Hi George
I have installed the smart check agent on my delivery controller and the site is listed within smart check on Citrix cloud. The XD site test runs and completes successfully. I have tried to run some more smart checks such as the Storefront,License server, PVS and i have added the relevant servers to each smart check then ran them but they all error out with errors such as below. The Account i added to Citrix cloud when adding the site is a full administrator on the DDC and target servers, Ping/ICMP is working to target servers, Winrm is enabled on the target servers, Powershell is version 5 and execution policy set to unrestricted on all servers, file & print sharing is enabled and i can connect to target servers via unc from the DDC with smart agent on
Any ideas as bit stumped what else i can check?
Check run failed : Smart Tools couldn’t copy the scripts required to run the check to the target machine (Servername.corp.com). Verify the target machine is powered on and reachable from the Delivery Controller where the Smart Tools Agent is installed.
George Spiers
July 31, 2018Hi John. Are you using the latest version of the agent? Anything in Event Viewer on the DDC that has the agent installed?
ProcMon might give indication as to what is wrong.
Have a read here if you haven’t already: https://docs.citrix.com/en-us/smart-tools/checks/about-health-checks.html#system-requirements-for-targeted-machines
John Carmody
July 31, 2018Hi George thanks for your responce. Yeah latest version of the Smart check Agent is installed on DDC 4.0.1.0 nothing in Event logs on DDC or target servers. Its a good shout bout procmon ill fire it up and take a look. Yeah i read through the Systrem requirements for targeted machines previously everything seems fine such as File&print sharing and Winrm so not sure why they are failing. I have raised a ticket with Citrix so will see what they come back with
Thanks again