Whilst not in-depth by any means, this post should hopefully help you understand how Load Balancing works on NetScaler and how some of the different options affect where your requests end up at the back-end.
Load balancing of a service can be performed in a number of ways as decided by the NetScaler administrator. We refer to the ways NetScaler load balances traffic as methods. A number of methods exist and some of the popular ones are:
- Round Robin – One of the most simple to configure and understand. Round Robin sends each request sequentially to back-end servers.
- Least Connection – The default method on NetScaler and suits most requirements. Directs traffic to the service that has least connections.
- Least Response Time – Directs traffic to the service that has least connections and lowest response time. Metrics are calculated every 7 seconds. This can be chosen for HTTP and SSL services only.
- Least Packets – Directs traffic to the service that has received the least packets in the last 14 seconds.
What I find is people often get confused as to how exactly requests are load balanced. In many cases, you may think that when browsing to a web page load balanced by NetScaler, the entire request is sent to a single specific service based on the load balancing method. The truth is that it is each HTTP GET request that is load balanced individually across the back-end servers. A request to load a web page generally results in several different HTTP GET and 200 OK responses.
To help you understand this better, in this example, I am load balancing the IIS default web page across two back-end servers. There is no persistency set and the load balancing method is Round Robin. It takes 3 HTTP GET requests from the client to load the IIS default web page. In return, it takes web servers 3 HTTP responses to send that requested data to the client. Here is a WireShark trace. You can see the three HTTP GET requests a client makes to NetScaler: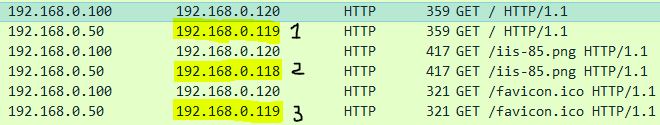
To confirm, I test web page hits against a single load balanced Virtual Server on NetScaler. 
The load balancing method used is Round Robin. 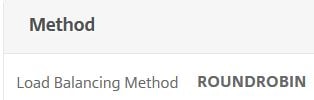
Two back-end web services are bound to the virtual server. Both configured on port 80 and using the same weight. 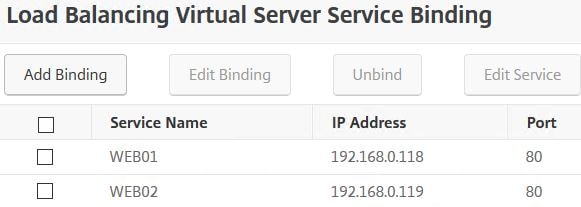
At the beginning, the services have received no hits. Now we will see what happens when you browse to the VIP. 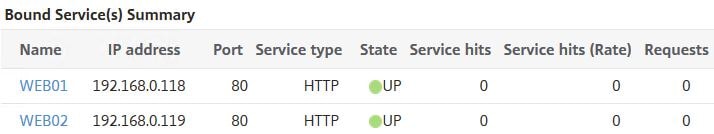
Using Internet Explorer, I enter the URL pointing to the load balanced VIP and successfully receive the default IIS splash page. 
Looking back at the Virtual Server statistics, you can see that my 3 HTTP GET requests were load balanced across both back-end servers. Not just one as many people would think. What happens if we browse to the VIP again?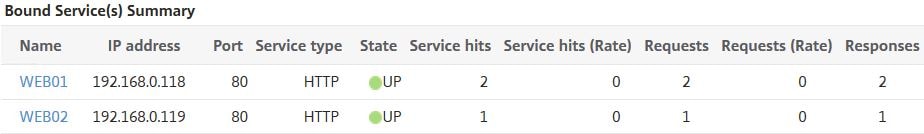
Since Round Robin is being used, we would indeed expect that the requests even out. Since WEB01 received the 1st and 3rd requests last time, this time WEB02 received the 1st and 3rd requests with WEB01 receiving the second. 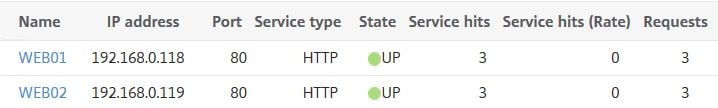
There are different features on NetScaler that affects how traffic is load balanced. One of these configurable settings is Weights. You can assign weights to each of your services for example if a web server can handle more requests than the other. In this example, I’ve assigned a weight of 5 to WEB02. What this will mean is that for every 1 request that reaches WEB01, 5 requests should be directed to WEB02. Let us test the theory.
Browsing to the load balanced VIP for the first time. 
The results show that WEB02 took two requests and WEB01 took one. 
Upon browsing to the VIP again, WEB02 takes all 3 requests. Now the next time we browse WEB01 should take atleast one request.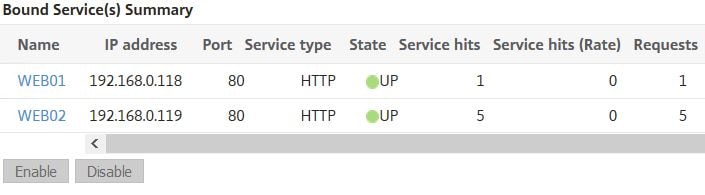
And it does. WEB01 takes another single request and WEB02 takes the other two. If I was to browse again, WEB02 would consume all three requests reaching a total of 10 requests.
As a summary, you may look at these statistics in production and think something is wrong, so it is important to understand how different settings affect load balancing even if it doesn’t look normal at first glance.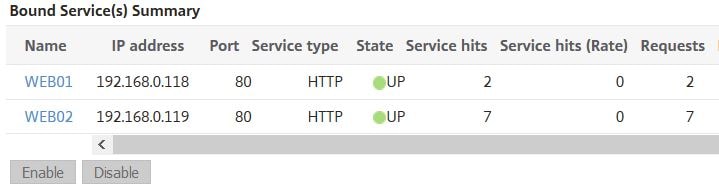
Persistence is another factor that controls which server receives a request, of course because with persistence clients are sent to the same back-end server until the persistent connection expires or is flushed. To show you how it does affect, I’ve configured SOURCEIP persistence on the load balanced Virtual Server with a timeout of 2 minutes.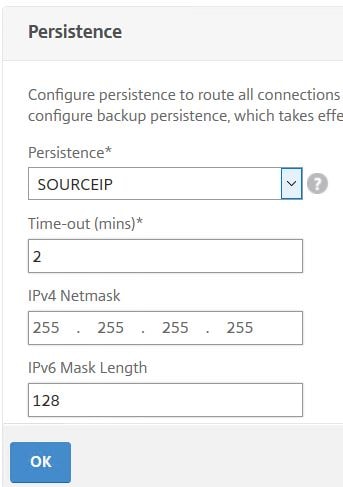
After browsing to the load balanced VIP address, all three requests as expected are sent to a single back-end server.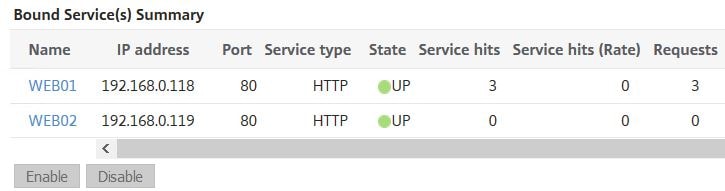
Browsing again within the 2 minute period sends all requests again to WEB01. 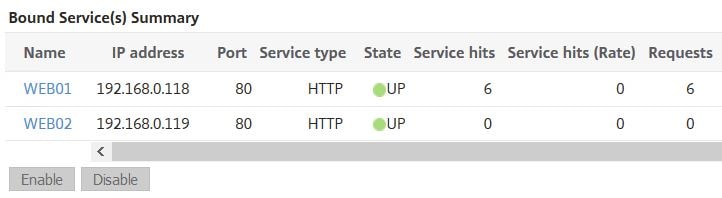
The next test sees persistence changed to COOKIEINSERT. As clients browse to the load balanced VIP, NetScaler sends a cookie to the client’s web browser which will later be used for persistency. The COOKIEINSERT method is also time based and once the time limit lapses, the existing cookie expires.
It is recommended that you use Version1 cookies to ensure compatibility with all clients. To configure Version1 cookies, navigate to System -> Settings -> Change HTTP Parameters -> Cookie.
All three requests successfully directed to WEB02. 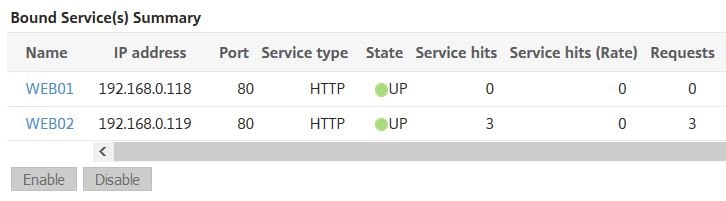
As mentioned, you can configure a timeout value. The default is 2 minutes. A timeout value of 0 would result in the persistent session never timing out. If you right-click the persistent cookie and view properties within Temporary Internet Files, you’ll see the expiry time of two minutes by default: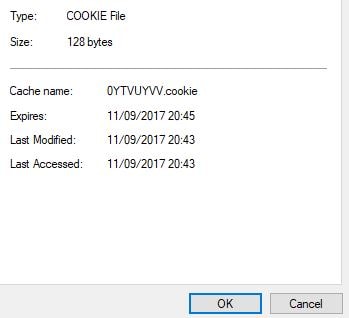
You can also specify a name for the cookie. If not specified, a cookie name is generated for you.
Cookie Insert persistence does not appear in the persistence table on NetScaler, because it is a cookie. To view the persistence table for other methods, navigate to Traffic Management -> Virtual Server persistence sessions.
You should also configure a Backup Persistence method when using COOKIEINSERT. This can be SOURCEIP. The reason being, in most cases you cannot control if browsers are configured to accept cookies. Also some browsers will empty cookies when closed.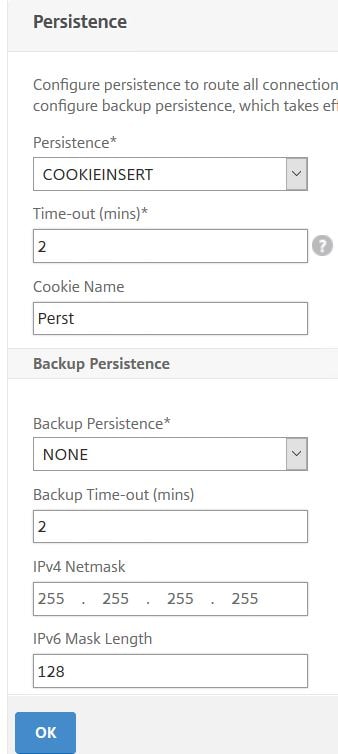
If you look at the services after enabling COOKIEINSERT persistence, you’ll see a generated Persistence Cookie Value. 
Finally, there are some other factors to be aware off that can affect how NetScaler balances requests. Without going in to too much detail, some of these are:
- Services that are DOWN will of course not receive any requests.
- Slow Start – If a Virtual Server state changes to online, or a new service is bound to a Virtual Server, the Virtual Server can initially use Round Robin to distribute requests to back-end servers. Eventually, the actual load balancing method specified on the Virtual Server will be used. NetScaler does this to prevent a single server becoming overloaded with requests. For example, you have Least Connection configured with two services both handling many requests. A new third service is bound to the Virtual Server and now a whole load of new requests flood to the new server which clearly will have the least connections. This could be overpowering for the back-end server and result in overload, which affects user experience as their request takes longer to complete. To configure Slow Start (also known as Startup Round Robin), you can do so either Globally or at a Virtual Server level. For example, setting Slow Start to a value of 10 will make NetScaler use Round Robin for the initial 10 requests before switching to the specified load balancing method.
- Gobally – Configure setting Startup RR Factor under Traffic Management -> Load Balancing -> Change Load Balancing Parameters.
- Virtual Server – Within the Virtual Server properties under Method, configure settings New Service Startup Request Rate and optionally Increment Interval.
- If specific values are not set globally or at Virtual Server level, by default a newly configured Virtual Server operates in Slow Start for the first 100 requests received. If one or more services are newly bound or newly enabled, or if the load balancing method is changed, NetScaler dynamically computes the number of requests to serve in Round Robin mode.
- Hash based load balancing methods are not supported with Startup Round Robin.
Praful
November 22, 2018How persistence work???
Internetuser
August 15, 2019In the wireshark trace, .50 and .100 are what? client and snip addresses?
George Spiers
August 19, 2019.100 = Client IP
.50 = SNIP
Morten
February 10, 2021Great explanation! I was squarely in the category of people who assumed the whole request would go to the same back-end.